 (English Edition) Sophia Factbook 2014
- ページ: Cover
- SOPHIA FACTBOOK
[English Edition]
2014
Sophia Factbook is a collection of the data related to Sophia School Corporation (Sophia University, Sophia University Junior College Division, Sophia School of Social Welfare) during the academic years 2005-2014.
�
- ▲TOP
- ページ: Index
- SOPHIA FACTBOOK
CONTENTS
Message on Publication………………………………………………1
Sophia School Corporation
1 Overview …………………………………………………………………… 2 2 Future Plans ……………………………………………………………… 9
Sophia University
1 Education ………………………………………………………………… 13 2 Faculty Members …………………………………………………… 36 3 International Features …………………………………………… 42 4 Campus Life …………………………………………………………… 49 5 Career Options ………………………………………………………
53
6 Library ……………………………………………………………………… 59 7 Research ………………………………………………………………… 60
Sophia University Junior College Division
1 Education ………………………………………………………………… 63 2 Faculty Members …………………………………………………… 66 3 International Features
………………………………………… 69
4 Campus Life …………………………………………………………… 69 5 Career Options ………………………………………………………
71
6 Library ……………………………………………………………………… 73
Sophia School of Social Welfare
1 Education and Research ……………………………………… 74 2 Students …………………………………………………………………… 77 3 Career Options ………………………………………………………
77
4 Library ……………………………………………………………………… 78
Financial Situation and others
1 Financial Situation ………………………………………………… 79 2 Staff Members ………………………………………………………… 85
�
- ▲TOP
- ページ: 1
- Message on Publication
Sophia School Corporation has decided to publish “Sophia Factbook”. It contains basic statistics on data collected and processed for the four schools held by Sophia School Corporation, namely, Sophia University, Sophia University Junior College Division, Sophia School of Social Welfare and Seibo Nursing School. Sophia School Corporation has created until now statistical documents depending on intended use, but the “Sophia Factbook” provides data for the past years up to ten on each data item to demonstrate the changes over time, offering a better and deeper understanding of the transition and features of each school. In August 2015 Sophia School Corporation established “Office for Institutional Research” intended to foster awareness of individuals working in both the academic organizations and clerical sections to perform their work firmly based on data and facts. We hope and expect that “Sophia Factbook” will provide basic materials for the management of the corporation and operation of the schools and contribute to improve their work, and at the same time, to promote the publicizing of information to all stakeholders.
March 1, 2016
Masafumi Hikima
Deputy Director Office for Institutional Research Sophia School Corporation
�
- ▲TOP
- ページ: 2
- Sophia School Corporation 1 Overview
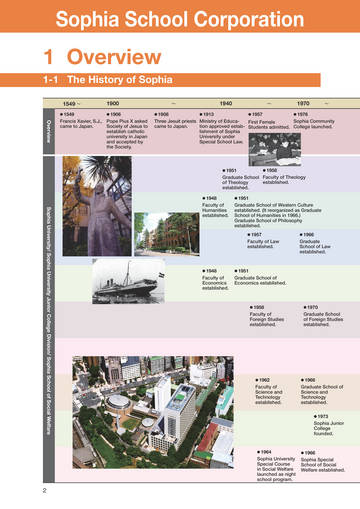
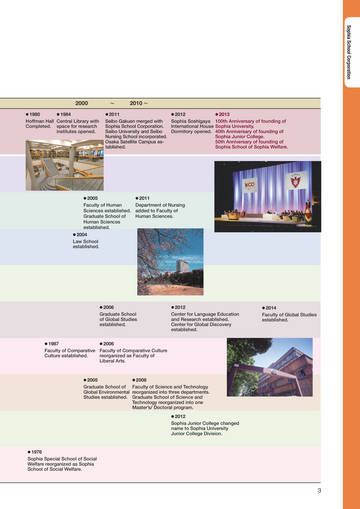
1-1 The History of Sophia
1549 〜
● 1549
1900
● 1908
〜
1940
〜
1970
〜
● 1906 Francis Xavier, S.J., Pope Pius X asked came to Japan. Society of Jesus to establish catholic university in Japan and accepted by the Society.
● 1913 ● 1957 ● 1976 Three Jesuit priests Ministry of EducaSophia Community First Female tion approved estab- Students admitted. College launched. came to Japan. lishment of Sophia University under Special School Law.
2
Overview Sophia University/ Sophia University Junior College Division/ Sophia School of Social Welfare
● 1951
● 1958 Graduate School Faculty of Theology established. of Theology established. ● 1951
● 1948
Faculty of Humanities established.
Graduate School of Western Culture established. (It reorganized as Graduate School of Humanities in 1966.) Graduate School of Philosophy established.
● 1957 ● 1966
Faculty of Law established.
Graduate School of Law established.
● 1948
● 1951
Faculty of Economics established.
Graduate School of Economics established.
● 1958
● 1970
Faculty of Foreign Studies established.
Graduate School of Foreign Studies established.
● 1962
● 1966
Faculty of Science and Technology established.
Graduate School of Science and Technology established.
● 1973
Sophia Junior College founded.
● 1964
● 1966
Sophia University Special Course in Social Welfare launched as night school program.
Sophia Special School of Social Welfare established.
�
- ▲TOP
- ページ: 5
- Sophia School Corporation
2000
● 1980 ● 1984 Hoffman Hall Central Library with Completed. space for research institutes opened.
〜
2010 〜
● 2013
● 2011 ● 2012 Seibo Gakuen merged with Sophia Soshigaya Sophia School Corporation. International House Seibo University and Seibo Dormitory opened. Nursing School incorporated. Osaka Satellite Campus established.
100th Anniversary of founding of Sophia University. 40th Anniversary of founding of Sophia Junior College. 50th Anniversary of founding of Sophia School of Sophia Welfare.
● 2005
● 2011 Faculty of Human Department of Nursing Sciences established. added to Faculty of Graduate School of Human Sciences. Human Sciences established.
● 2004
Law School established.
● 2006
● 2012
● 2014
Graduate School of Global Studies established.
Center for Language Education and Research established. Center for Global Discovery established.
Faculty of Global Studies established.
● 1987
● 2006 Faculty of Comparative Faculty of Comparative Culture Culture established. reorganized as Faculty of Liberal Arts.
● 2005
● 2008 Graduate School of Faculty of Science and Technology Global Environmental reorganized into three departments. Studies established. Graduate School of Science and Technology reorganized into one Master’s/ Doctoral program. ● 2012
Sophia Junior College changed name to Sophia University Junior College Division.
● 1976
Sophia Special School of Social Welfare reorganized as Sophia School of Social Welfare.
3
�
- ▲TOP
- ページ: 4
- Sophia School Corporation
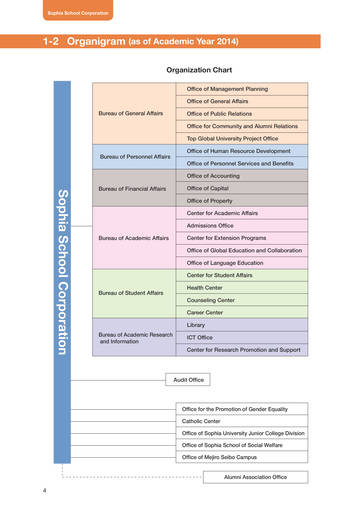
1-2 Organigram (as of Academic Year 2014)
Organization Chart
Office of Management Planning Office of General Affairs Bureau of General Affairs Office of Public Relations Office for Community and Alumni Relations Top Global University Project Office Bureau of Personnel Affairs Office of Human Resource Development Office of Personnel Services and Benefits Office of Accounting Bureau of Financial Affairs Office of Capital Office of Property Center for Academic Affairs Admissions Office Bureau of Academic Affairs Center for Extension Programs Office of Global Education and Collaboration Office of Language Education Center for Student Affairs Bureau of Student Affairs Health Center Counseling Center Career Center Library Bureau of Academic Research and Information ICT Office Center for Research Promotion and Support
Sophia School Corporation
4
Audit Office
Office for the Promotion of Gender Equality Catholic Center Office of Sophia University Junior College Division Office of Sophia School of Social Welfare Office of Mejiro Seibo Campus Alumni Association Office
�
- ▲TOP
- ページ: 7
- Sophia School Corporation
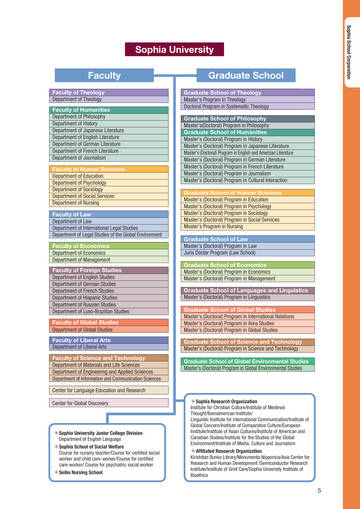
Sophia University Faculty
Faculty of Theology Department of Theology Faculty of Humanities Department of Philosophy Department of History Department of Japanese Literature Department of English Literature Department of German Literature Department of French Literature Department of Journalism Faculty of Human Sciences Department of Education Department of Psychology Department of Sociology Department of Social Services Department of Nursing Faculty of Law Department of Law Department of International Legal Studies Department of Legal Studies of the Global Environment Faculty of Economics Department of Economics Department of Management Faculty of Foreign Studies Department of English Studies Department of German Studies Department of French Studies Department of Hispanic Studies Department of Russian Studies Department of Luso-Brazilian Studies Faculty of Global Studies Department of Global Studies Faculty of Liberal Arts Department of Liberal Arts Faculty of Science and Technology Department of Materials and Life Sciences Department of Engineering and Applied Sciences Department of Information and Communication Sciences Center for Language Education and Research Center for Global Discovery
*Sophia Research Organization Institute for Christian Culture/Institute of Medieval Thought/Iberoamerican Institute/ Linguistic Institute for International Communication/Institute of Global Concern/Institute of Comparative Culture/European Institute/Institute of Asian Cultures/Institute of American and Canadian Studies/Institute for the Studies of the Global Environment/Institute of Media, Culture and Journalism
Graduate School
Graduate School of Theology Master's Program in Theology Doctoral Program in Systematic Theology Graduate School of Philosophy Master's(Doctoral) Program in Philosophy Graduate School of Humanities Master's (Doctoral) Program in History Master's (Doctoral) Program in Japanese Literature Master's (Doctoral) Program in English and American Literature Master's (Doctoral) Program in German Literature Master's (Doctoral) Program in French Literature Master's (Doctoral) Program in Journalism Master’s (Doctoral) Program in Cultural Interaction Graduate School of Human Sciences Master's (Doctoral) Program in Education Master's (Doctoral) Program in Psychology Master's (Doctoral) Program in Sociology Master's (Doctoral) Program in Social Services Master’s Program in Nursing Graduate School of Law Master's (Doctoral) Program in Law Juris Doctor Program (Law School) Graduate School of Economics Master's (Doctoral) Program in Economics Master's (Doctoral) Program in Management Graduate School of Languages and Linguistics Master's (Doctoral) Program in Linguistics Graduate School of Global Studies Master's (Doctoral) Program in International Relations Master's (Doctoral) Program in Area Studies Master's (Doctoral) Program in Global Studies Graduate School of Science and Technology Master’s (Doctoral) Program in Science and Technology Graduate School of Global Environmental Studies Master's (Doctoral) Program in Global Environmental Studies
*Sophia University Junior College Division Department of English Language *Sophia School of Social Welfare Course for nursery teacher/Course for certified social worker and child care-worker/Course for certified care-worker/ Course for psychiatric social worker *Seibo Nursing School
*Affiliated Research Organization Kirishitan Bunko Library/Monumenta Nipponica/Asia Center for Research and Human Development /Semiconductor Research Institute/Institute of Grief Care/Sophia University Institute of Bioethics 5
�
- ▲TOP
- ページ: 6
- Sophia School Corporation
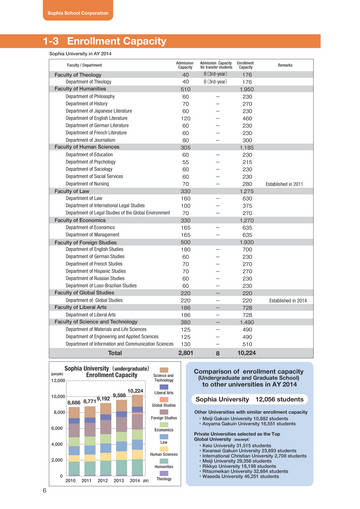
1-3 Enrollment Capacity
Sophia University in AY 2014
Faculty / Department Admission Capacity Admission Capacity for transfer students Enrollment Capacity Remarks
Faculty of Theology Department of Theology Faculty of Humanities Department of Philosophy Department of History Department of Japanese Literature Department of English Literature Department of German Literature Department of French Literature Department of Journalism Faculty of Human Sciences Department of Education Department of Psychology Department of Sociology Department of Social Services Department of Nursing Faculty of Law Department of Law Department of International Legal Studies Department of Legal Studies of the Global Environment Faculty of Economics Department of Economics Department of Management Faculty of Foreign Studies Department of English Studies Department of German Studies Department of French Studies Department of Hispanic Studies Department of Russian Studies Department of Luso-Brazilian Studies Faculty of Global Studies Department of Global Studies Faculty of Liberal Arts Department of Liberal Arts Faculty of Science and Technology Department of Materials and Life Sciences Department of Engineering and Applied Sciences Department of Information and Communication Sciences
40 40 510 60 70 60 120 60 60 80 305 60 55 60 60 70 330 160 100 70 330 165 165 500 180 60 70 70 60 60 220 220 186 186 380 125 125 130
8 (3rd-year) 8 (3rd-year)
- - - - - - - - - - - - - - - - - - - - - - - - - - - - - - -
176 176 1,950 230 270 230 460 230 230 300 1,185 230 215 230 230 280 1,275 630 375 270 1,270 635 635 1,930 700 230 270 270 230 230 220 220 728 728 1,490 490 490 510
Established in 2011
Established in 2014
Total
2,801
8
10,224
(people)
12,000 10,000 8,000
Sophia University(undergraduate) Science and Enrollment Capacity
Technology
Comparison of enrollment capacity
(Undergraduate and Graduate School)
8,686 8,771
9,192
9,598
10,224
to other universities in AY 2014
Liberal Arts Global Studies Foreign Studies
Sophia University 12,056 students
Other Universities with similar enrollment capacity ・Meiji Gakuin University 10,882 students ・Aoyama Gakuin University 16,551 students Private Universities selected as the Top Global University(excerpt) ・Keio University 31,515 students ・Kwansei Gakuin University 23,693 students ・International Christian University 2,708 students ・Meiji University 29,358 students ・Rikkyo University 18,198 students ・Ritsumeikan University 32,684 students ・Waseda University 46,251 students
6,000 4,000 2,000
Economics
Law Human Sciences Humanities
0
2010
2011
2012
2013
2014 (AY)
Theology
6
�
- ▲TOP
- ページ: 9
- Sophia School Corporation
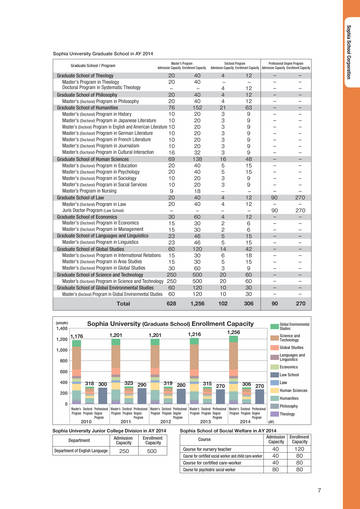
Sophia University Graduate School in AY 2014
Graduate School / Program
Master's Program Admission Capacity Enrollment Capacity Doctoral Program Professional Degree Program Admission Capacity Enrollment Capacity Admission Capacity Enrollment Capacity
20 Graduate School of Theology 20 Master's Program in Theology Doctoral Program in Systematic Theology 20 Graduate School of Philosophy 20 Master's (Doctoral) Program in Philosophy 76 Graduate School of Humanities 10 Master's (Doctoral) Program in History Master's (Doctoral) Program in Japanese Literature 10 Master's (Doctoral) Program in English and American Literature 10 Master's (Doctoral) Program in German Literature 10 Master's (Doctoral) Program in French Literature 10 Master's (Doctoral) Program in Journalism 10 Master’s (Doctoral) Program in Cultural Interaction 16 69 Graduate School of Human Sciences 20 Master's (Doctoral) Program in Education Master's (Doctoral) Program in Psychology 20 Master's (Doctoral) Program in Sociology 10 Master's (Doctoral) Program in Social Services 10 Master’s Program in Nursing 9 20 Graduate School of Law Master's (Doctoral) Program in Law 20 Juris Doctor Program (Law School) 30 Graduate School of Economics Master's (Doctoral) Program in Economics 15 Master's (Doctoral) Program in Management 15 Graduate School of Languages and Linguistics 23 Master's (Doctoral) Program in Linguistics 23 Graduate School of Global Studies 60 Master's (Doctoral) Program in International Relations 15 Master's (Doctoral) Program in Area Studies 15 Master's (Doctoral) Program in Global Studies 30 Graduate School of Science and Technology 250 Master’s (Doctoral) Program in Science and Technology 250 Graduate School of Global Environmental Studies 60 Master's (Doctoral) Program in Global Environmental Studies 60
40 40 40 40 152 20 20 20 20 20 20 32 138 40 40 20 20 18 40 40 60 30 30 46 46 120 30 30 60 500 500 120 120
4 4 4 4 21 3 3 3 3 3 3 3 16 5 5 3 3 4 4 4 2 2 5 5 14 6 5 3 20 20 10 10
12 12 12 12 63 9 9 9 9 9 9 9 48 15 15 9 9 12 12 12 6 6 15 15 42 18 15 9 60 60 30 30
90 90 -
270 270 -
Total
(people)
628
1,256
102
306
90
270
1,400
Sophia University (Graduate School) Enrollment Capacity
1,176 1,201 1,201 1,216 1,256
Global Environmental Studies Science and Technology Global Studies
1,200 1,000 800 600 400 200 0
Languages and Linguistics
Economics Law School
318 300
323 290
319 280
315 270
306 270
Law
Human Sciences Humanities Philosophy Theology
(AY)
Master's Doctoral Professional Master's Doctoral Professional Master's Doctoral Professional Master's Doctoral Professional Master's Doctoral Professional Program Program Degree Program Program Degree Program Program Degree Program Program Degree Program Program Degree Program Program Program Program Program
2010
2011
2012
2013
2014
Sophia University Junior College Division in AY 2014 Department Department of English Language Admission Capacity 250 Enrollment Capacity 500
Sophia School of Social Welfare in AY 2014 Admission Enrollment Course Capacity Capacity Course for nursery teacher Course for certified social worker and child care-worker Course for certified care-worker Course for psychiatric social worker 40 40 40 80 120 80 80 80
7
�
- ▲TOP
- ページ: 8
- Sophia School Corporation
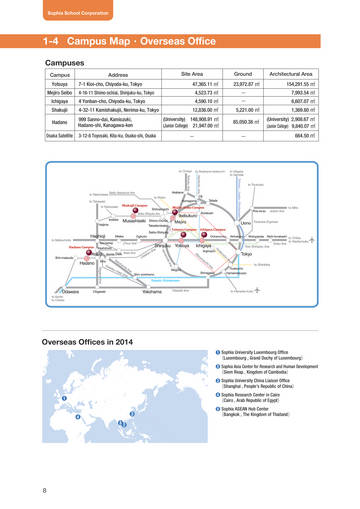
1-4 Campus Map・Overseas Office
Campuses
Campus Yotsuya Mejiro Seibo Ichigaya Shakujii Hadano Osaka Satellite Address 7-1 Kioi-cho, Chiyoda-ku, Tokyo 4-16-11 Shimo-ochiai, Shinjuku-ku, Tokyo 4 Yonban-cho, Chiyoda-ku, Tokyo 4-32-11 Kamishakujii, Nerima-ku, Tokyo 999 Sanno-dai, Kamiozuki, Hadano-shi, Kanagawa-ken 3-12-8 Toyosaki, Kita-ku, Osaka-shi, Osaka Site Area 47,365.11 ㎡ 4,523.73 ㎡ 4,590.10 ㎡ 12,836.00 ㎡ (University) 148,908.91 ㎡ (Junior College) 21,947.00 ㎡ Ground 23,972.87 ㎡ Architectural Area 154,291.55 ㎡ 7,993.54 ㎡ 6,607.07 ㎡ 1,369.80 ㎡ (University) 2,908.67 ㎡ (Junior College) 9,840.07 ㎡ 664.50 ㎡
̶ ̶
5,221.00 ㎡ 85,050.38 ㎡
̶
̶
Overseas Offices in 2014
❶ Sophia University Luxembourg Office (Luxembourg , Grand Duchy of Luxembourg) ❷ Sophia Asia Center for Research and Human Development (Siem Reap , Kingdom of Cambodia) ❸ Sophia University China Liaison Office (Shanghai , People's Republic of China)
❶ ❹ ❸ ❺ ❷
❹ Sophia Research Center in Cairo (Cairo , Arab Republic of Egypt) ❺ Sophia ASEAN Hub Center (Bangkok , The Kingdom of Thailand)
8
�
- ▲TOP
- ページ: 9
- 2 Future Plans
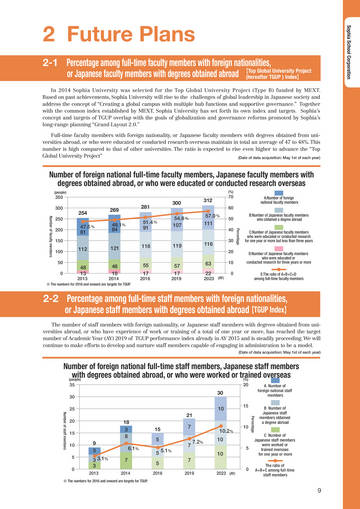
2-1 Percentage among full-time faculty members with foreign nationalities, Top Global University Project or Japanese faculty members with degrees obtained abroad 【 (hereafter TGUP ) Index】
In 2014 Sophia University was selected for the Top Global University Project (Type B) funded by MEXT. Based on past achievements, Sophia University will rise to the challenges of global leadership in Japanese society and address the concept of “Creating a global campus with multiple hub functions and supportive governance.” Together with the common index established by MEXT, Sophia University has set forth its own index and targets. Sophia’s concept and targets of TGUP overlap with the goals of globalization and governance reforms promoted by Sophia’s long-range planning “Grand Layout 2.0.” Full-time faculty members with foreign nationality, or Japanese faculty members with degrees obtained from universities abroad, or who were educated or conducted research overseas maintain in total an average of 47 to 48%. This number is high compared to that of other universities. The ratio is expected to rise even higher to advance the “Top Global University Project” (Date of data acquisition: May 1st of each year)
Sophia School Corporation
Number of foreign national full-time faculty members, Japanese faculty members with degrees obtained abroad, or who were educated or conducted research overseas
(people) (%)
350 300
254
47.5 %
269
49.1%
281
51.4 %
300
54.8 %
312 57.0 % 111
70 60 50 40
Percentage
A:Number of foreign national faculty members B:Number of Japanese faculty members who obtained a degree abroad C:Number of Japanese faculty members who were educated or conducted research for one year or more but less than three years D:Number of Japanese faculty members who were educated or conducted research for three years or more E:The ratio of A+B+C+D among full-time faculty members
※ The numbers for 2016 and onward are targets for TGUP.
2-2 Percentage among full-time staff members with foreign nationalities, or Japanese staff members with degrees obtained abroad【TGUP Index】
The number of staff members with foreign nationality, or Japanese staff members with degrees obtained from universities abroad, or who have experience of work or training of a total of one year or more, has reached the target number of Academic Year (AY) 2019 of TGUP performance index already in AY 2015 and is steadily proceeding. We will continue to make efforts to develop and nurture staff members capable of engaging in administration to be a model.
(Date of data acquisition: May 1st of each year)
Number of faculty members
250 200 150 100 50 0
81
84
91
107
112 48 13
121 46 18
118
119
116
30 20
55
2016
2013
2014
17
2019
57 17
63
2023 (AY)
10 0
22
Number of foreign national full-time staff members, Japanese staff members with degrees obtained abroad, or who were worked or trained overseas (people) (%)
35 30 25
Number of staff members
20
30 10 21 18 3 8 9 3 3 3.1% 3
2013 15
Percentage
A Number of foreign national staff members B Number of Japanese staff members obtained a degree abroad
20 15 10 5 0
15 5 5 5.1% 5
2016
7 7 7
2019
10.2% 7.2% 10
10
6.1% 7
2014
5
10
0
C Number of Japanese staff members were worked or trained overseas for one year or more The ratio of A+B+C among full-time staff members
2023 (AY)
※ The numbers for 2016 and onward are targets for TGUP.
9
�
- ▲TOP
- ページ: 10
- Sophia School Corporation
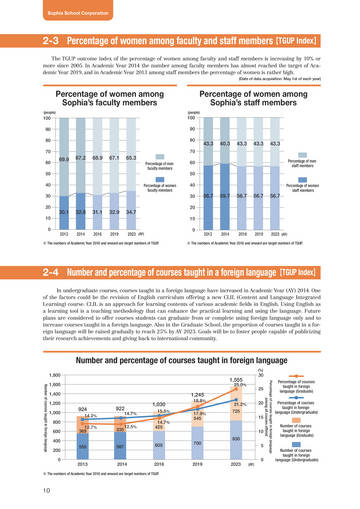
2-3 Percentage of women among faculty and staff members【TGUP Index】
The TGUP outcome index of the percentage of women among faculty and staff members is increasing by 10% or more since 2005. In Academic Year 2014 the number among faculty members has almost reached the target of Academic Year 2019, and in Academic Year 2013 among staff members the percentage of women is rather high.
(Date of data acquisition: May 1st of each year)
Percentage of women among Sophia’s faculty members
(people)
Percentage of women among Sophia’s staff members
(people)
100 90 80 70 60 50 40 30 20 10 0 2013 2014 2016 2019 2023 (AY)
Percentage of women faculty members
100 90 80 70
43.3
40.3
43.3
43.3
43.3
Percentage of men staff members
69.9
67.2
68.9
67.1
65.3
Percentage of men faculty members
60 50 40 30
Percentage of women staff members
56.7
59.7
56.7
56.7
56.7
30.1
32.8
31.1
32.9
34.7
20 10 0 2013 2014 2016 2019 2023 (AY)
※ The numbers of Academic Year 2016 and onward are target numbers of TGUP.
※ The numbers of Academic Year 2016 and onward are target numbers of TGUP.
2-4 Number and percentage of courses taught in a foreign language【TGUP Index】
In undergraduate courses, courses taught in a foreign language have increased in Academic Year (AY) 2014. One of the factors could be the revision of English curriculum offering a new CLIL (Content and Language Integrated Learning) course. CLIL is an approach for learning contents of various academic fields in English. Using English as a learning tool is a teaching methodology that can enhance the practical learning and using the language. Future plans are considered to offer courses students can graduate from or complete using foreign language only and to increase courses taught in a foreign language. Also in the Graduate School, the proportion of courses taught in a foreign language will be raised gradually to reach 25% by AY 2023. Goals will be to foster people capable of publicizing their research achievements and giving back to international community.
Number and percentage of courses taught in foreign language
(%)
1,800 1,600 1,400 1,200 1,000 800 600 400 200 0 555 587
Number of courses taught in foreign language
1,555 1,245 924
14.2% 12.7% 369 335
30 25
among all courses offered
25.0%
Percentage of courses taught in foreign language (Graduate) Percentage of courses taught in foreign language (Undergraduate) Number of courses taught in foreign language (Graduate) Number of courses taught in foreign language (Undergraduate)
Percentage of courses taught in foreign language
922
1,030
15.5% 14.7% 425
18.8% 17.9% 545
21.2% 725
20 15 10
14.7% 12.5%
605
700
830 5 0
2013
2014
2016
2019
2023
(AY)
※ The numbers of Academic Year 2016 and onward are target numbers of TGUP.
10
�
- ▲TOP
- ページ: 11
- Sophia School Corporation
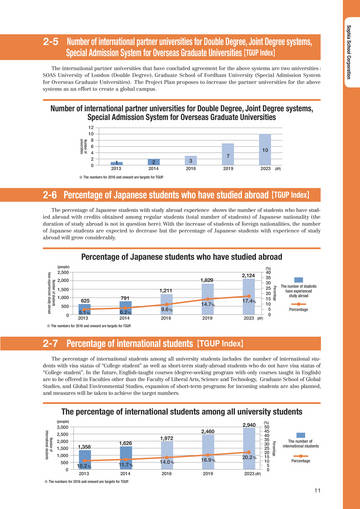
2-5 Number of international partner universities for Double Degree, Joint Degree systems, Special Admission System for Overseas Graduate Universities【TGUP Index】
The international partner universities that have concluded agreement for the above systems are two universities : SOAS University of London (Double Degree), Graduate School of Fordham University (Special Admission System for Overseas Graduate Universities). The Project Plan proposes to increase the partner universities for the above systems as an effort to create a global campus.
Number of international partner universities for Double Degree, Joint Degree systems, Special Admission System for Overseas Graduate Universities
12 10 8 6 4 2 0
Number of universities
1
2013
2
2014
3
2016
7
2019
10
2023
(AY)
※ The numbers for 2016 and onward are targets for TGUP.
2-6 Percentage of Japanese students who have studied abroad【TGUP Index】
The percentage of Japanese students with study abroad experience shows the number of students who have studied abroad with credits obtained among regular students (total number of students) of Japanese nationality (the duration of study abroad is not in question here). With the increase of students of foreign nationalities, the number of Japanese students are expected to decrease but the percentage of Japanese students with experience of study abroad will grow considerably.
Percentage of Japanese students who have studied abroad
(people)
2,500 2,000 1,500 1,000 500 0 2013
(%)
1,829 1,211 625 5.1 % 791 6.2 %
2014
2,124
9.6 %
2016
14.7%
2019
17.4%
2023 (AY)
40 35 30 25 20 15 10 5 0
※ The numbers for 2016 and onward are targets for TGUP.
2-7 Percentage of international students【TGUP Index】
The percentage of international students among all university students includes the number of international students with visa status of “College student” as well as short-term study-abroad students who do not have visa status of “College student”. In the future, English-taught courses (degree-seeking program with only courses taught in English) are to be offered in Faculties other than the Faculty of Liberal Arts, Science and Technology, Graduate School of Global Studies, and Global Environmental Studies, expansion of short-term programs for incoming students are also planned, and measures will be taken to achieve the target numbers.
※ The numbers for 2016 and onward are targets for TGUP.
Number of students have experienced study abroad
The number of students have experienced study abroad Percentage
The percentage of international students among all university students
(people)
Percentage
3,000
Number of International students
2,940 2,460 1,358 1,626 1,972
(%)
2,500 2,000 1,500 1,000 500 0
10.2 %
2013
11.7 %
2014
14.0 %
2016
16.9 %
2019
20.2 %
2023 (AY)
50 45 40 35 30 25 20 15 10 5 0
The number of international students Percentage
Percentage
11
�
- ▲TOP
- ページ: 12
- Sophia School Corporation
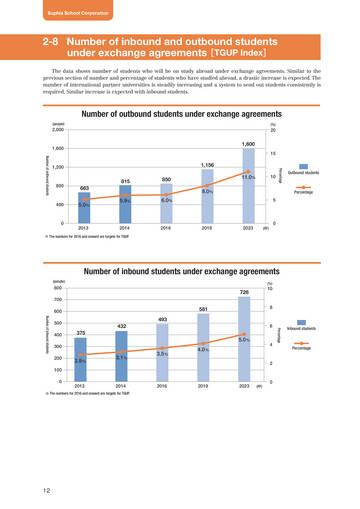
2-8 Number of inbound and outbound students under exchange agreements[TGUP Index]
The data shows number of students who will be on study abroad under exchange agreements. Similar to the previous section of number and percentage of students who have studied abroad, a drastic increase is expected. The number of international partner universities is steadily increasing and a system to send out students consistently is required. Similar increase is expected with inbound students.
Number of outbound students under exchange agreements
(people) (%)
2,000
20
1,600
Number of outbound students
1,600
15
1,200
1,156
Percentage
800
815 663 5.0% 5.9%
850 8.0% 6.0%
11.0%
10
Outbound students
Percentage
400
5
0
2013
2014
2016
2019
2023
(AY)
0
※ The numbers for 2016 and onward are targets for TGUP.
Number of inbound students under exchange agreements
(people)
800 700 600
Number of inbound students
(%)
726 581 493 432 375 5.0 % 3.1 % 3.5 % 4.0 %
10
8
500 400 300 200 100 0 2013
6
Inbound students
Percentage
4
Percentage
2.8 %
2
2014
2016
2019
2023
(AY)
0
※ The numbers for 2016 and onward are targets for TGUP.
12
�
- ▲TOP
- ページ: 13
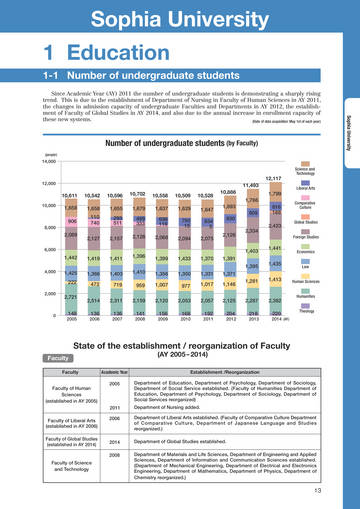
- Sophia University 1 Education
1-1 Number of undergraduate students
Since Academic Year (AY) 2011 the number of undergraduate students is demonstrating a sharply rising trend. This is due to the establishment of Department of Nursing in Faculty of Human Sciences in AY 2011, the changes in admission capacity of undergraduate Faculties and Departments in AY 2012, the establishment of Faculty of Global Studies in AY 2014, and also due to the annual increase in enrollment capacity of these new systems. (Date of data acquisition: May 1st of each year)
Sophia University
Number of undergraduate students (by Faculty)
(people)
14,000
Science and Technology Liberal Arts Comparative Culture Global Studies Foreign Studies
12,000
12,117 11,493 10,611 10,542 1,658 110 740 2,127 10,596 1,655 293 511 2,157 10,702 1,679 499 333 2,126 10,558 1,637 699 116 2,068 10,509 1,629 790 15 2,094 10,528 1,647 834 5 2,075 10,886 1,766 1,693 830 2,126 809 2,334 816 188 2,423 1,799
10,000
1,658 906
8,000
2,089
6,000
1,442
4,000
1,419 1,366 472 2,514
2006
1,411 1,403 719 2,311
2007
1,396 1,410 959 2,159
2008
1,403 1,399 1,356 1,007 2,120
2009
1,441 1,435 1,413
Economics Law Human Sciences Humanities Theology
1,433 1,350 977 2,053
2010
1,370 1,331 1,017 2,057
2011
1,391 1,395 1,371 1,146 2,125
2012
1,425 222
1,281
2,000
2,721 148
2005
2,287
2013
2,382
2014 (AY)
0
136
136
141
156
168
192
204
218
220
State of the establishment / reorganization of Faculty
Faculty
Faculty Faculty of Human Sciences (established in AY 2005) Academic Year 2005
(AY 2005-2014)
Establishment /Reorganization Department of Education, Department of Psychology, Department of Sociology, Department of Social Service established. (Faculty of Humanities Department of Education, Department of Psychology, Department of Sociology, Department of Social Services reorganized) Department of Nursing added. Department of Liberal Arts established. (Faculty of Comparative Culture Department of Comparative Culture, Department of Japanese Language and Studies reorganized.) Department of Global Studies established. Department of Materials and Life Sciences, Department of Engineering and Applied Sciences, Department of Information and Communication Sciences established. (Department of Mechanical Engineering, Department of Electrical and Electronics Engineering, Department of Mathematics, Department of Physics, Department of Chemistry reorganized.)
2011 Faculty of Liberal Arts (established in AY 2006) Faculty of Global Studies (established in AY 2014) 2006
2014 2008
Faculty of Science and Technology
13
�
- ▲TOP
- ページ: 16
- Sophia University
Faculty of Theology
(people)
Faculty of Humanities
(people)
250
3,000
2,721 218 220
200
176 2,514
Social Services
204 192 168
2,500
2,000
150
148 136 136
156 141
1,500
Theology
171 124 2,311 119 61 2,159 2,120 289 67 6 2,053 294 13 4 2 299 320 316 242 306 232 249 232 248 253 230 247 245 257 277 466 267 480 478 213 217 308 234 304 293 130 233 306 12 12 481
2,287 2,057
317 242 253
2,382 Sociology
362 Journalism French Literature German Literature English Literature
2,125
314
328
278 257 291 264
283
285
100
1,000
484 446 489 491
544
562
Japanese Literature History Psychology Education
229 219 204 227
248 270
50
500 188
66 198 143 76
296 301 290 303 300 315 13
238 241 243 271 257 265 262 269 298 305 Philosophy
0 0
2005 2006 2007 2008 2009 2010 2011 2012 2013 2014 (AY)
2005 2006 2007 2008 2009 2010 2011 2012 2013 2014 (AY)
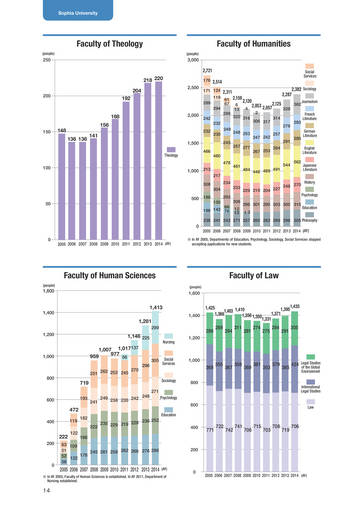
※ In AY 2005, Departments of Education, Psychology, Sociology, Social Services stopped accepting applications for new students.
Faculty of Human Sciences
(people)
Faculty of Law
(people)
1,600
1,600
1,400
1,413 1,281
299
1,400
1,425 1,403 1,410 1,366 1,356 1,350 286 289 294 311 281 274
1,435 1,395 1,371 1,331 275 284 291 305
1,200
1,146 225 1,007 1,017 137 977 959 56
251 262 252 245 270 296
Nursing
1,200
1,000
305
Social Services
1,000
368
800
355
367
358
369
361
353
379
385
Studies 424 Legal of the Global Environment
800
719
193 249 238 235 242 248 271
Sociology
International Legal Studies
600
241
Psychology
472
400 119 182 236 252 235 229 219 229 222
600
Education
Law
400
222
200
122
771
722
742
741
706
715
703
708
719
706
166
200
0
63 109 51 245 261 258 262 268 276 286 52 122 178 56
2005 2006 2007 2008 2009 2010 2011 2012 2013 2014
(AY)
※ In AY 2005, Faculty of Human Sciences is established. In AY 2011, Department of Nursing established.
0
2005 2006 2007 2008 2009 2010 2011 2012 2013 2014 (AY)
14
�
- ▲TOP
- ページ: 17
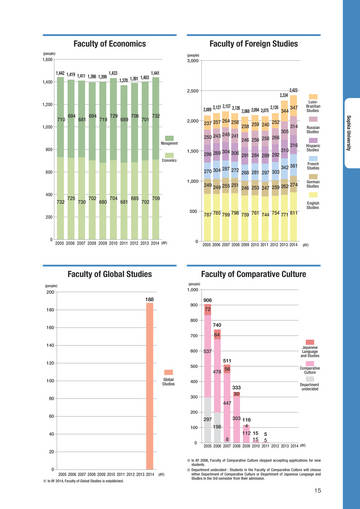
- Faculty of Economics
(people)
Faculty of Foreign Studies
(people)
1,600
3,000
1,400
1,442 1,419 1,433 1,411 1,396 1,399
1,403 1,370 1,391
1,441
2,500
2,334
2,423
LusoBrazilian Studies
1,200
710
1,000
694
681
694
719
729
689
706
701
732
2,157 2,126 2,126 347 2,089 2,127 344 2,068 2,094 2,075
2,000
Sophia University
237 257
264 258
252 258 259 240 246 256 258 266
248 241 250 243
Management
305 310
314 316
Russian Studies Hispanic Studies French Studies German Studies
800
Economics
1,500
304 306 296 289 291 284 289 292 270 304 287 272 268 281 297 303
600
1,000
342 361 274
249 249 255 251
246 253 247 259 262
400
732
200
725
730
702
680
704
681
685
702
709
500
787 785 799 798 759 761 744 754 771 811
English Studies
0
2005 2006 2007 2008 2009 2010 2011 2012 2013 2014 (AY)
0
2005 2006 2007 2008 2009 2010 2011 2012 2013 2014
(AY)
Faculty of Global Studies
(people)
(people)
Faculty of Comparative Culture
1,000
200
188
180
900 800
906 72 740 64 537 511 56
Japanese Language and Studies Comparative Culture
160
700
140
600
120
Global Studies
500
478
100
400
333
300
30
Department undecided
80
447
200
60
297
100
40
0
303 116 4 198 112 15 15 8
2005 2006 2007 2008 2009 2010 2011 2012 2013 2014 (AY)
5 5
20
※ In AY 2006, Faculty of Comparative Culture stopped accepting applications for new students. ※ Department undecided : Students in the Faculty of Comparative Culture will choose either Department of Comparative Culture or Department of Japanese Language and Studies in the 3rd semester from their admission.
0
2005 2006 2007 2008 2009 2010 2011 2012 2013 2014 (AY)
※ In AY 2014, Faculty of Global Studies is established.
15
�
- ▲TOP
- ページ: 16
- Sophia University
Faculty of Liberal Arts
(people) (people)
Faculty of Science and Technology
2,000
900
834 830
800
790 699
809 816
1,800
1,766 1,693
1,799 Information
700
1,658 1,658 1,655 1,679 1,637 1,629 1,647 152 1,600 397 417
1,400
and Communication Sciences
428 147 115
270
572 389 545 545
581 Engineering
and Applied Sciences
600
500
499
1,200
267 231 229 227 338 405 254 173 155 230 371 113 300 103 195 114 547 579 633 629
Materials and Life Sciences Chemistry Physics Mathematics Electrical and Electronics Engineering
400
Liberal Arts
1,000
211 204 208
800
300
293
600
415 409 399
200
400
110
100
200
404 399 393
299
205
67 557 556 587 58 501 109 Mechanical 116 19 12
7 12 4 1 1 4 1 5 3 1 1 1 1
Engineering
0
2005 2006 2007 2008 2009 2010 2011 2012 2013 2014 (AY)
0
2005 2006 2007 2008 2009 2010 2011 2012 2013 2014 (AY)
※ In AY 2006, Faculty of Liberal Arts is established.
※ In AY 2008, Departments of Mechanical Engineering, Electrical and Electronics Engineering, Mathematics, Physics, Chemistry stopped accepting applications for new students. In AY 2008, Departments of Materials and Life Sciences, Engineering and Applied Sciences, Information and Communication Sciences are established.
1-2 Number of Graduate School students
From Academic Year AY 2005 to 2014, the number of students in Graduate School remains relatively constant with a slight increase and decrease. The number of students in Pre-doctorate/Master’s Program remains around 900 in total since AY 2010, although there was a decreasing trend in AY 2008 and 2009. The number of students in each Graduate School varies by academic year, but a distinctive trend of Pre-doctorate/ Master’s Programs is the fact that number of students enrolled in Graduate School of Science and Technology accounts for about 40% of the total. The number of students in Doctoral Programs remains constant around 230, showing only a small range of increase and decrease. Number of students in Juris Doctor Program (Law School) is on a declining trend (Date of data acquisition : May 1st of each year) since AY 2009.
Number of Graduate School students
(people)
1,600 1,400 1,200 1,000 800 600 400 200 0 2005
1,342 207 263
1,414 256 235
1,405 272 233
1,378 278 249
1,371 287 250
1,454 272 241
1,458 250 216
1,420 226 221
1,339 193 230
1,318 165 232
Juris Doctor Program Doctoral Program
872
923
900
851
834
941
992
973
916
921
Pre-doctorate/ Master’s Program
2006
2007
2008
2009
2010
2011
2012
2013
2014
(AY)
16
�
- ▲TOP
- ページ: 19
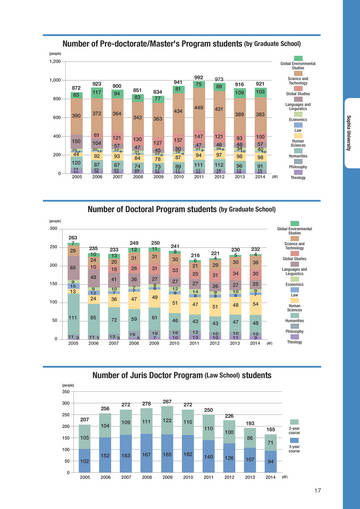
- Number of Pre-doctorate/Master's Program students (by Graduate School)
(people)
1,200
Global Environmental Studies
1,000
800
872 65
923 117
900 94
851 83
834 77
941 81
992 75
973 89
916 109
921 103
Science and Technology Global Studies Languages and Linguistics
600
390
372
364
434 343 363
449
431
389
383
Sophia University
Economics Law
400
61 150
22 17
104
20 12
121
22 9
130
31 12
57 93 87
21 32
47 84 74
20 27
200
44
24 40
92 87
22 36
127 45 78 73
17 26
137
19
147
21 9
121
26 8
50 87 89
17 19 8
47
46
22 6
94 111
2011
17 22
97 112
2012
16 27
93 46 34 10 98 96
2013
12 29
100 57 40 10 98 91
2014
16 23
Human Sciences Humanities Philosophy
(AY)
120
0 2005
2006
2007
2008
2009
2010
Theology
Number of Doctoral Program students (by Graduate School)
(people)
300
250
263 7 29 65
9 15
Global Environmental Studies
200
235 10 24 10 49
9 12
233 13 20 18 41
10 7
249 12 31 26 36
7 7
250 11 31 31 27
8 6
241 8 30 33 27
12 8
216 6 21 25 27
14 8
221 4 29 31 26
9 8
230 5 30 34 27
10 8
232 4 36 30 25
9 7
Science and Technology Global Studies Languages and Linguistics Economics Law Human Sciences Humanities Philosophy
(AY)
150
13
100
24
36
47
49
51 46
16 10
47 43
12 13
51 43
10 10
48 47
10 11
54
50
111
85
72
13 3
59
19
61
19
48
10 9
0
11 3
11 1
2005
2006
2007
2008
5
7
2009
2010
2011
2012
2013
2014
Theology
Number of Juris Doctor Program (Law School) students
(people)
350 300 250 200 150 100 50 0
256 207 104 105 152
272 109
278 111
287
272 110
250 110
122
226 193 100 165 86 71
2-year course 3-year course
102
2005
163
167
165
162
140
126
107
2013
94
2014
(AY)
2006
2007
2008
2009
2010
2011
2012
17
�
- ▲TOP
- ページ: 20
- Sophia University
State of the establishment / reorganization of Graduate Program
(AY 2005 - 2014)
Pre-doctorate, Master’s program / Doctoral Program
Graduate School Graduate School of Humanities Graduate School of Human Sciences (established in AY 2005) Graduate School of Economics Academic Year 2011 2005 Establishment /Reorganization ※ MP, DP in Cultural Interaction established. MP, DP in Education, MP, DP in Psychology, MP, DP in Sociology established. (Graduate school of Humanities MP, DP in Education, MP, DP in Psychology, MP, DP in Sociology reorganized.), MP,DP in Social Services added. Pre-doctorate Program in Nursing added. DP in Economics and DP in Management established. (DP in Economic Systems and Organizations reorganized.) MP in Management added. MP in International Relations, MP in Area Studies established. (Graduate school of Foreign Studies MP, DP in International Relations, MP, DP in Area Studies reorganized.) MP in Global Studies established.(Graduate school of Foreign Studies MP in Comparative Culture reorganized.) DP in Global Studies added. MP, DP in Science and Technology established. (MP, DP in Mechanical Engineering, MP, DP in Electrical and Electronics Engineering, MP, DP in Applied Chemistry, MP, DP in Chemistry, MP, DP in Mathematics, MP,DP in Physics, MP,DP in Biological Science reorganized.) MP, DP in Global Environmental Studies established.
2011 2007
2006 Graduate School of Global Studies (established in AY 2006)
Graduate School of Science and Technology Graduate School of Global Environmental Studies (established in AY 2005)
2008
2005
※ MP=Master’s Program, DP=Doctoral Program
18
�
- ▲TOP
- ページ: 19
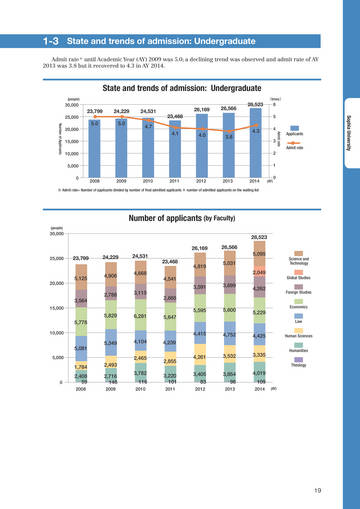
- 1-3 State and trends of admission: Undergraduate
Admit rate ※ until Academic Year (AY) 2009 was 5.0; a declining trend was observed and admit rate of AY 2013 was 3.8 but it recovered to 4.3 in AY 2014.
State and trends of admission: Undergraduate
(people) (times)
30,000
23,799
25,000
24,229 5.0
24,531 4.7
26,169 23,468 4.1
26,566
28,523
6 5
Sophia University
5.0
20,000 15,000 10,000 5,000 0 2008
※ Admit rate= Number of applicants divided by number of final admitted applicants + number of admitted applicants on the waiting list
(people)
30,000
25,000
20,000
15,000
10,000
5,000
Number of Applicants
4.0
3.8
4.3
4
Admit rate
Applicants Admit rate
3 2 1
2009
2010
2011
2012
2013
2014
(AY)
0
Number of applicants (by Faculty)
28,523 26,169 23,799 24,229 4,906 24,531 4,668 23,468 4,541 3,591 2,865 5,595 5,647 4,415 5,081 1,784
0
26,566 5,095 5,031 2,049 3,699 4,262
Science and Technology Global Studies Foreign Studies Economics
4,819
5,125
3,564
2,788
3,115
5,829 5,778
5,600
6,281
5,229
Law
4,752
5,349
4,104 2,465
4,425
Human Sciences Humanities Theology
4,239 2,855 3,220 101
2011
4,261 3,405 83
2012
3,532 3,854 98
2013
3,335 4,019 109
2014
(AY)
2,493 2,716 148
2009
2,408 59
2008
3,782 116
2010
19
�
- ▲TOP
- ページ: 20
- Sophia University
Admit rate (by Faculty)
(people)
Applicants for admission to Faculty of Liberal Arts
(people)
8
700
622
7
Science and Technology Global Studies Foreign Studies Economics Law
600
584 514 528 496 545
597
6
500
5
400
300 320 302 270 303 375 320
4
Applicants for autumn semester
300
3
Human Sciences
Applicants for spring semester
2
4.6 — 5.5 5.8 5.1 5.3 3.6 3.1 4.0 — 4.9 6.1 5.5 7.1 3.7 7.4 3.5 — 4.3 6.8 4.5 5.8 4.3 4.6 3.4 — 3.6 6.3 4.1 5.3 3.1 2.8 3.7 — 3.7 4.9 3.7 6.2 2.6 2.4 3.3 — 3.3 5.2 3.9 5.0 3.1 3.0 4.2 6.7 4.1 5.2 3.6 5.4 3.6 4.0
200
Humanities
214 264 226 226 242 247 277
Theology
1
100
0
2008
2009
2010
2011
2012
2013
2014 (AY)
0
2008 2009 2010 2011 2012 2013 2014 (AY)
1-4 State and trends of admission: Graduate School
State and trends of Graduate School admission: Pre-doctorate/Master’s Program
(people)
State and trends of Graduate School admission: Doctoral Program
(people)
900
100
800
786
781
90 80 70 60
92 3 77 3 78 6 64
700
675 634 46 43
55 739 81 42 687 692 57 78
600
71 1
73 3 59 3
500
Applicants for autumn semester
8
Applicants for autumn semester Applicants for spring semester
50 40 30
400
591 629 731 697 630 614 700
300
Applicants for spring semester
89
70
70
56
74
72
56
200
20
100
10 0
0
2008 2009 2010 2011 2012 2013 2014 (AY)
2008 2009 2010 2011 2012 2013 2014 (AY)
20
�
- ▲TOP
- ページ: 21
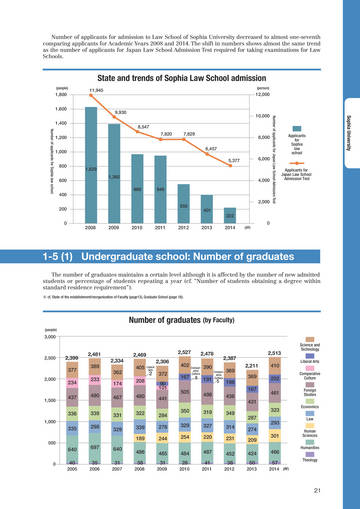
- Number of applicants for admission to Law School of Sophia University decreased to almost one-seventh comparing applicants for Academic Years 2008 and 2014. The shift in numbers shows almost the same trend as the number of applicants for Japan Law School Admission Test required for taking examinations for Law Schools.
State and trends of Sophia Law School admission
(people)
1,800 1,600 1,400
Number of applicants for Sophia law school
11,945
(person)
12,000
9,930 8,547 7,820 7,829 6,457 5,377
10,000
Sophia University
Number of applicants for Japan Law School Admission Test
1,200 1,000 800 600 400 200 0
8,000
Applicants for Sophia law school
6,000
1,629 1,392 969 949 2,000 401 222 0 4,000
Applicants for Japan Law School Admission Test
550
2008
2009
2010
2011
2012
2013
2014
(AY)
1-5 (1) Undergraduate school: Number of graduates
The number of graduates maintains a certain level although it is affected by the number of new admitted students or percentage of students repeating a year (cf. “Number of students obtaining a degree within standard residence requirement”).
※ cf. State of the establishment/reorganization of Faculty (page13), Graduate School (page 18).
Number of graduates (by Faculty)
(people)
3,000
2,500
2,399 377
2,481 389 233 490 339 298 2,334 362 174 467 331 329
2,469 405 208 480 322 339 189 2,306
Liberal Arts
2,527 402 167 505
2,478
Comparative Culture
2,387
Comparative
2,513 2,211 369 167 410 202 461 323 287 274 209 424 50
2013
Science and Technology Liberal Arts Comparative Culture Foreign Studies Economics Law Human Sciences Humanities Theology
390
2
2,000
372 90 101 441 284 278 244 465 31
2009
369
234 437 336
8
191 Culture 5 198 498 319 327 220 487 41
2011
1,500
436 349 314 231 452 38
2012
431
350 329 254 484 28
2010
1,000
335
500
293 301 466 57
2014 (AY)
640
0
697 35
2006
640 31
2007
486 38
2008
40
2005
21
�
- ▲TOP
- ページ: 22
- Sophia University
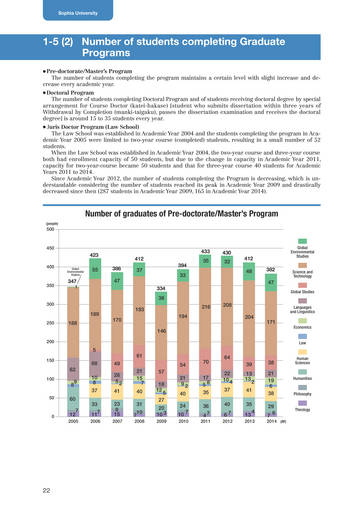
1-5 (2) Number of students completing Graduate Programs
Pre-doctorate/Master’s Program The number of students completing the program maintains a certain level with slight increase and decrease every academic year.
● ●
Doctoral Program The number of students completing Doctoral Program and of students receiving doctoral degree by special arrangement for Course Doctor (katei-hakase) [student who submits dissertation within three years of Withdrawal by Completion (manki-taigaku), passes the dissertation examination and receives the doctoral degree] is around 15 to 35 students every year.
Juris Doctor Program (Law School) The Law School was established in Academic Year 2004 and the students completing the program in Academic Year 2005 were limited to two-year course (completed) students, resulting in a small number of 52 students. When the Law School was established in Academic Year 2004, the two-year course and three-year course both had enrollment capacity of 50 students, but due to the change in capacity in Academic Year 2011, capacity for two-year-course became 50 students and that for three-year course 40 students for Academic Years 2011 to 2014. Since Academic Year 2012, the number of students completing the Program is decreasing, which is understandable considering the number of students reached its peak in Academic Year 2009 and drastically decreased since then (287 students in Academic Year 2009, 165 in Academic Year 2014).
●
Number of graduates of Pre-doctorate/Master’s Program
(people)
500
450
423
400
Global Environmental Studies
433 412 386 47 334 36 216 194 146 37 394 33 35
430 32
412 48 382 47
Global Environmental Studies Science and Technology Global Studies
55
350
347
1
300
189
250
183 170
208 204 171
Languages and Linguistics Economics Law
188
200
5
150
61 49 26 52 41 23 8 15
2007
68 62 9 10 8 37 33 7 11
2006
54 21 15 7 40 31 7 10
2008
70 17 58 35 36 47
2011
64 39 22 10 4 37 40 67
2012
38 21 19 6 38 29 6 7
2014 (AY)
Human Sciences Humanities Philosophy Theology
57 18 12 5 27 20 10 3
2009
100
8
21 92 40 24 7 10
2010
13 13 2 41 35 4 13
2013
50
60 12 7
0
2005
22
�
- ▲TOP
- ページ: 25
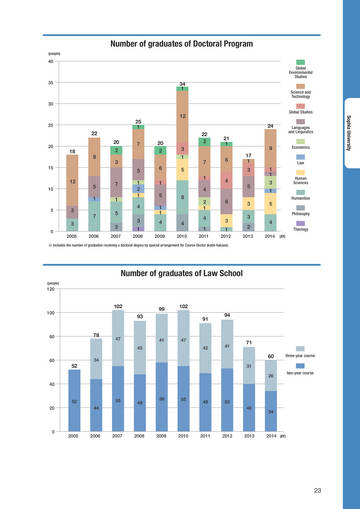
- Number of graduates of Doctoral Program
(people)
40
Global Environmental Studies
35
34 1
Science and Technology Global Studies
30
25
25 1 22 20 18 2 9 3 5 12 5 1 7 1 5 3 2
2006 2007
12 24 20 2 6 1 5 1 1 4
2009
Sophia University
20
7
22 2 3 1 5 1 4 8 2 1 4 1
2011
Languages and Linguistics Economics Law
21 1 6 17 1 3 4 5 3 3 2
2013
9
15
7
1 1 3 1
10
1 2 1 4
Human Sciences Humanities
6
5
Philosophy
5
3 3
7
0
1
2008
4
2010
3 1
2012
4
Theology
2005
2014
(AY)
※ Includes the number of graduates receiving a doctoral degree by special arrangement for Course Doctor (katei-hakase).
Number of graduates of Law School
(people)
120
102
100
99 93
102 91 94
80
78
47 45
41
47 42 41
71 60
31 26
two-year course three-year course
60
34
52
40 55 44 58 55
52 20
48
49
53 40 34
0
2005
2006
2007
2008
2009
2010
2011
2012
2013
2014 (AY)
23
�
- ▲TOP
- ページ: 24
- Sophia University
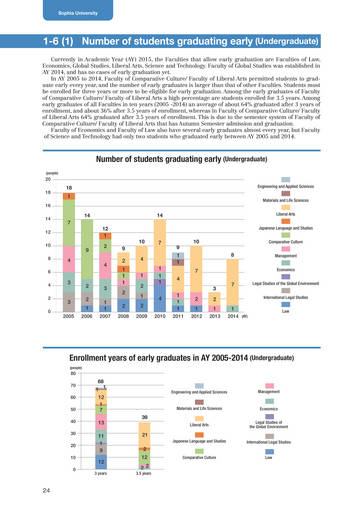
1-6 (1) Number of students graduating early (Undergraduate)
Currently in Academic Year (AY) 2015, the Faculties that allow early graduation are Faculties of Law, Economics, Global Studies, Liberal Arts, Science and Technology. Faculty of Global Studies was established in AY 2014, and has no cases of early graduation yet. In AY 2005 to 2014, Faculty of Comparative Culture/ Faculty of Liberal Arts permitted students to graduate early every year, and the number of early graduates is larger than that of other Faculties. Students must be enrolled for three years or more to be eligible for early graduation. Among the early graduates of Faculty of Comparative Culture/ Faculty of Liberal Arts a high percentage are students enrolled for 3.5 years. Among early graduates of all Faculties in ten years (2005 -2014) an average of about 64% graduated after 3 years of enrollment, and about 36% after 3.5 years of enrollment, whereas in Faculty of Comparative Culture/ Faculty of Liberal Arts 64% graduated after 3.5 years of enrollment. This is due to the semester system of Faculty of Comparative Culture/ Faculty of Liberal Arts that has Autumn Semester admission and graduation. Faculty of Economics and Faculty of Law also have several early graduates almost every year, but Faculty of Science and Technology had only two students who graduated early between AY 2005 and 2014.
Number of students graduating early (Undergraduate)
(people)
20 18 16 14 12 10 8 6 4 2 0
18 1 14 12 1 9 4 2 4 9 2 1 1 1 2 2
2008
Engineering and Applied Sciences Materials and Life Sciences
14 7 10 4 1 2 1 2
2009
Liberal Arts Japanese Language and Studies
7
9 1 1
10 8 7
Comparative Culture Management Economics
3
2 2 1
2006
1 1 1 4
2010
4 3 1 1 1
2011
3 1 1
2007
7
Legal Studies of the Global Environment International Legal Studies
3
2005
2 1
2012
2 1
2013
1
2014
(AY)
Law
Enrollment years of early graduates in AY 2005-2014 (Undergraduate)
(people)
80 70 60 50 40 30 20 10 0
68 1 1 12 1 7 13 11 1 9 12
3 years
Engineering and Applied Sciences
Management
Materials and Life Sciences
Economics Legal Studies of the Global Environment International Legal Studies Law
39
Liberal Arts
21
Japanese Language and Studies
2 12 2 2
3.5 years Comparative Culture
24
�
- ▲TOP
- ページ: 25
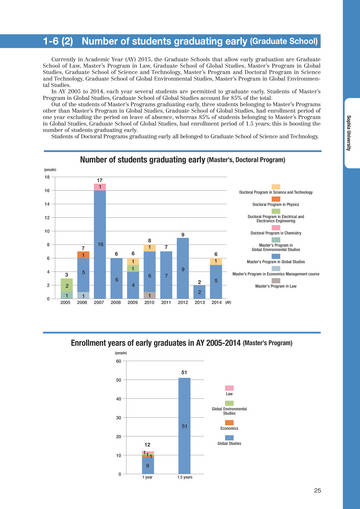
- 1-6 (2) Number of students graduating early (Graduate School)
Currently in Academic Year (AY) 2015, the Graduate Schools that allow early graduation are Graduate School of Law, Master’s Program in Law, Graduate School of Global Studies, Master’s Program in Global Studies, Graduate School of Science and Technology, Master’s Program and Doctoral Program in Science and Technology, Graduate School of Global Environmental Studies, Master’s Program in Global Environmental Studies. In AY 2005 to 2014, each year several students are permitted to graduate early. Students of Master’s Program in Global Studies, Graduate School of Global Studies account for 85% of the total. Out of the students of Master’s Programs graduating early, three students belonging to Master’s Programs other than Master’s Program in Global Studies, Graduate School of Global Studies, had enrollment period of one year excluding the period on leave of absence, whereas 85% of students belonging to Master’s Program in Global Studies, Graduate School of Global Studies, had enrollment period of 1.5 years; this is boosting the number of students graduating early. Students of Doctoral Programs graduating early all belonged to Graduate School of Science and Technology.
Sophia University
Number of students graduating early (Master’s, Doctoral Program)
(people)
18 16 14 12 10 8 6 4 2 0
17 1
Doctoral Program in Science and Technology Doctoral Program in Physics Doctoral Program in Electrical and Electronics Engineering
7 1 5
16 6 6 1 1 6
8 1
9 7 6 1 9
Doctoral Program in Chemistry Master's Program in Global Environmental Studies Master's Program in Global Studies Master’s Program in Economics Management course
3 2 1
2005
6 4 1
2009 2010
7 2 2
2011 2012 2013
5
Master's Program in Law
1
2006 2007 2008
2014 (AY)
Enrollment years of early graduates in AY 2005-2014 (Master’s Program)
(people)
60
51
50
Law
40
Global Environmental Studies
30
51
20
Economics Global Studies
12
10
11 9
1
0
1 year
1.5 years
25
�
- ▲TOP
- ページ: 26
- Sophia University
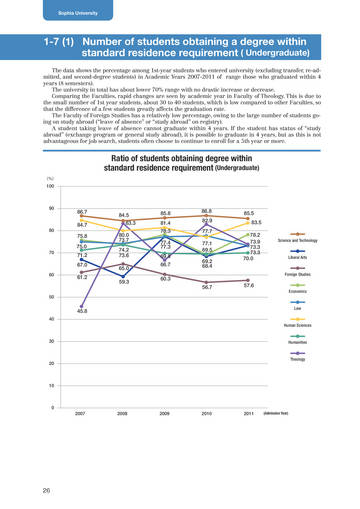
1-7 (1) Number of students obtaining a degree within standard residence requirement ( Undergraduate)
The data shows the percentage among 1st-year students who entered university (excluding transfer, re-admitted, and second-degree students) in Academic Years 2007-2011 of range those who graduated within 4 years (8 semesters). The university in total has about lower 70% range with no drastic increase or decrease. Comparing the Faculties, rapid changes are seen by academic year in Faculty of Theology. This is due to the small number of 1st year students, about 30 to 40 students, which is low compared to other Faculties, so that the difference of a few students greatly affects the graduation rate. The Faculty of Foreign Studies has a relatively low percentage, owing to the large number of students going on study abroad (“leave of absence” or “study abroad” on registry). A student taking leave of absence cannot graduate within 4 years. If the student has status of “study abroad” (exchange program or general study abroad), it is possible to graduate in 4 years, but as this is not advantageous for job search, students often choose to continue to enroll for a 5th year or more.
Ratio of students obtaining degree within standard residence requirement (Undergraduate)
(%)
100
90
86.7 84.7 75.8 75.0
84.5 83.3 80.0 73.7 74.2 73.6 65.0 59.3
85.8 81.4 78.3 77.4 77.3 69.8 66.7 60.3
86.8 82.9 77.7 77.1 69.5 69.2 68.4
85.5 83.5 78.2 73.9 73.3 73.3 70.0
Science and Technology
80
70
71.2 67.0
Liberal Arts
60
61.2
Foreign Studies
56.7
57.6
Economics
50
45.8
40
Law
Human Sciences
30
Humanities
20
Theology
10
0 2007 2008 2009 2010 2011
(Admission Year)
26
�
- ▲TOP
- ページ: 27
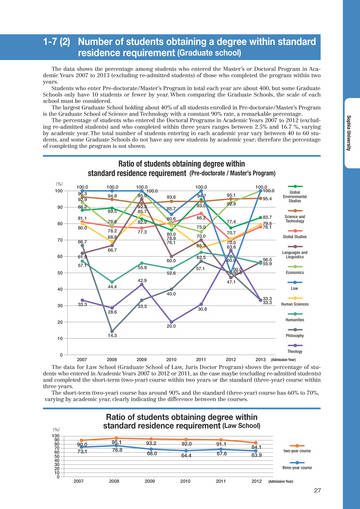
- 1-7 (2) Number of students obtaining a degree within standard residence requirement (Graduate school)
The data shows the percentage among students who entered the Master’s or Doctoral Program in Academic Years 2007 to 2013 (excluding re-admitted students) of those who completed the program within two years. Students who enter Pre-doctorate / Master’s Program in total each year are about 400, but some Graduate Schools only have 10 students or fewer by year. When comparing the Graduate Schools, the scale of each school must be considered. The largest Graduate School holding about 40% of all students enrolled in Pre-doctorate/ Master’s Program is the Graduate School of Science and Technology with a constant 90% rate, a remarkable percentage. The percentage of students who entered the Doctoral Programs in Academic Years 2007 to 2012 (excluding re-admitted students) and who completed within three years ranges between 2.5% and 16.7 %, varying by academic year. The total number of students entering in each academic year vary between 40 to 60 students, and some Graduate Schools do not have any new students by academic year; therefore the percentage of completing the program is not shown.
Sophia University
Ratio of students obtaining degree within standard residence requirement (Pre-doctorate / Master’s Program)
(%)
100 90 80 70 60 50 40 30 20 10 0
100.0 96.3 92.9 88.2 81.1 80.0 66.7 61.9 57.1
100.0 94.8 89.5 78.6 78.2 68.8 66.7
100.0 100.0 95.0 92.3 85.7 82.9 77.3
100.0 93.6 85.7 80.6 80.0 78.9 76.1 94.7 93.5 86.2 75.0 70.0 65.3 62.5 57.1 70.7 70.0 63.6 60.0 50.0 50.0 47.1 95.1 92.9
100.0 100.0 95.4
Global Environmental Studies
77.4
83.7 79.5 78.1
Science and Technology
Global Studies
60.0 55.9 52.6 42.9 44.4 40.0
56.5 55.9
Languages and Linguistics
Economics
Law
33.3 28.6
33.3
33.3 33.3 30.8
Human Sciences
Humanities
20.0 14.3
Philosophy
Theology
2007
2008
2009
2010
2011
2012
2013
(Admission Year)
The data for Law School (Graduate School of Law, Juris Doctor Program) shows the percentage of students who entered in Academic Years 2007 to 2012 or 2011, as the case maybe (excluding re-admitted students) and completed the short-term (two-year) course within two years or the standard (three-year) course within three years. The short-term (two-year) course has around 90% and the standard (three-year) course has 60% to 70%, varying by academic year, clearly indicating the difference between the courses.
(%)
Ratio of students obtaining degree within standard residence requirement (Law School)
90.0 73.1 95.1 76.8 93.2 68.0 92.0 64.4 91.1 67.6 84.1 63.9
two-year course
100 90 80 70 60 50 40 30 20 10 0
three-year course
2007
2008
2009
2010
2011
2012
(Admission Year)
27
�
- ▲TOP
- ページ: 28
- Sophia University
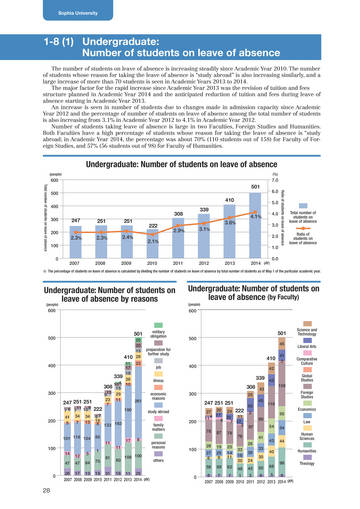
1-8 (1) (1) Undergraduate: Undergraduate school: Number of students on leave of Number absence of students on leave of absence
The number of students on leave of absence is increasing steadily since Academic Year 2010. The number of students whose reason for taking the leave of absence is “study abroad” is also increasing similarly, and a large increase of more than 70 students is seen in Academic Years 2013 to 2014. The major factor for the rapid increase since Academic Year 2013 was the revision of tuition and fees structure planned in Academic Year 2014 and the anticipated reduction of tuition and fees during leave of absence starting in Academic Year 2013. An increase is seen in number of students due to changes made in admission capacity since Academic Year 2012 and the percentage of number of students on leave of absence among the total number of students is also increasing from 3.1% in Academic Year 2012 to 4.1% in Academic Year 2012. Number of students taking leave of absence is large in two Faculties, Foreign Studies and Humanities. Both Faculties have a high percentage of students whose reason for taking the leave of absence is “study abroad; in Academic Year 2014, the percentage was about 70% (110 students out of 158) for Faculty of Foreign Studies, and 57% (56 students out of 98) for Faculty of Humanities.
Undergraduate: Number of students on leave of absence
(people) (%)
600
7.0
501
500
※ The percentage of students on leave of absence is calculated by dividing the number of students on leave of absence by total number of students as of May 1 of the particular academic year.
28
Total number of students on leave of absence
6.0 5.0
Ratio of students on leave of absence
410
400
308
300 200 100 0
339 4.1% 3.6% 3.1%
4.0 3.0 2.0 1.0
247 2.3%
251 2.3%
251 2.4%
222 2.1%
Total number of students on leave of absence Ratio of students on leave of absence
2.9%
2007
2008
2009
2010
2011
2012
2013
2014 (AY)
0.0
Undergraduate: Number of students on leave of absence by reasons (people)
600
Undergraduate: Number of students on leave of absence (by Faculty)
(people)
600
500
501
20 20 15 410 29 11 23 17 18 339 28 104 10 308 15 13 29 9 23 11 261 7 222 190 67 16 8 133 163 95 11 1 70 81 11 80 108 100 17 8
military obligation preparation for further study job illness economic reasons study abroad family matters personal reasons others
500
501
45
Science and Technology Liberal Arts Comparative Culture Global Studies
410
400
42
400
41 3
339 42
300
300
308 43
25
158 Foreign Studies 116 50 Economics Law 54 44 Human Sciences Humanities 98 Theology
247 251 251
200
11 10 8 76 7 34 34 41 13 7 5
247 251 251
27 20 24 222 17 22 11 11 4 8 7 22 3 78 87 79 76 28 27 6 58 19 25 9 59 25 14 11 62 23 18 20 48
45 50 2 89 97 41 26 36 24 45 33 30 50
200
54 43 40 68
101 116 104
100
14 47
12 47
5 64
100
0
26 17 13 19 31 16 11 25 2007 2008 2009 2010 2011 2012 2013 2014 (AY)
0
5 3 8 7 8 8 7 1 2007 2008 2009 2010 2011 2012 2013 2014 (AY)
�
- ▲TOP
- ページ: 29
- 1-8 (2) Graduate School: Number of students on leave of absence
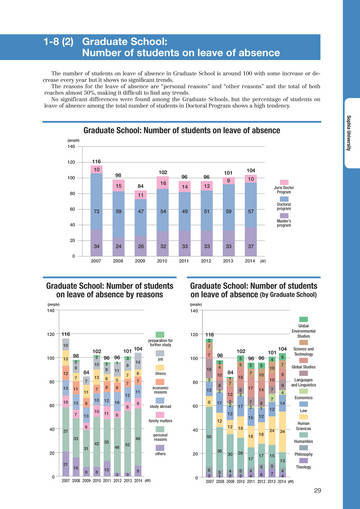
The number of students on leave of absence in Graduate School is around 100 with some increase or decrease every year but it shows no significant trends. The reasons for the leave of absence are “personal reasons” and “other reasons” and the total of both reaches almost 50%, making it difficult to find any trends. No significant differences were found among the Graduate Schools, but the percentage of students on leave of absence among the total number of students in Doctoral Program shows a high tendency.
Sophia University
Graduate School: Number of students on leave of absence
(people)
140 120 100 80 60 40 20
116 10 98 15 84 11 72 59 47 54 49 51 59 57 102 16 96 14 96 12 101 9 104 10
Juris Doctor Program Doctoral program Master’s program
34
0 2007
24
2008
26
2009
32
2010
33
2011
33
2012
33
2013
37
2014
(AY)
Graduate School: Number of students on leave of absence by reasons
(people)
Graduate School: Number of students on leave of absence (by Graduate School)
(people)
140
140
Global Environmental Studies
120
116
10
120
116
3 7
100
13 12
98
2 9 7 11 13 7
102
2 10
101 104 96 96
2 8 6 9 12 11 1 11 5 8 16 6 3 9 7 7 12 8 14 6 7 11 9
preparation for further study job illness
100
7 16
98
3 4 10 8 2 17
102
5 5
96 96
5 7 17 7 2 15 5 10 14 8 1 12
101
4 10 10 7 7 12
104
6 7 9 9 4 14
Science and Technology Global Studies Languages and Linguistics Economics Law Human Sciences Humanities
84
7 11 8 13 6
80
13 10
13 7 10 10
84
1 7 12 2 2 12
80
economic reasons study abroad family matters personal reasons others
3 12 9
16 6 2 17
60
60
12
40
37 33
40
50 36
12
18 18 18
24
34
20
21 16
31
42
35 46
48 52
20
30
26 17
17
15
Philosophy 13
0
9 3 3 2007 2008 2009 2010 2011 2012 2013 2014 (AY) 8 8
13
0
5 5 Theology 6 5 4 4 4 5 7 6 3 2 2 4 4 1 2007 2008 2009 2010 2011 2012 2013 2014 (AY)
29
�
- ▲TOP
- ページ: 30
- Sophia University
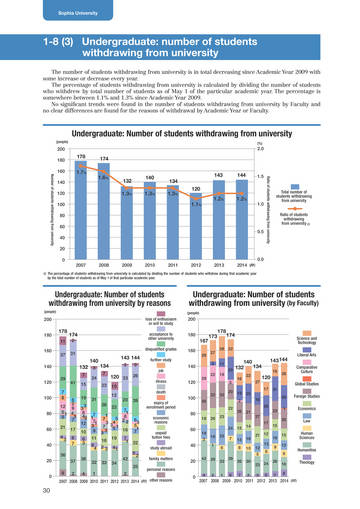
1-8 (3) Undergraduate: number of students withdrawing from university
The number of students withdrawing from university is in total decreasing since Academic Year 2009 with some increase or decrease every year. The percentage of students withdrawing from university is calculated by dividing the number of students who withdrew by total number of students as of May 1 of the particular academic year. The percentage is somewhere between 1.1% and 1.3% since Academic Year 2009. No significant trends were found in the number of students withdrawing from university by Faculty and no clear differences are found for the reasons of withdrawal by Academic Year or Faculty.
Undergraduate: Number of students withdrawing from university
(people) (%)
200 180 160
Number of students withdrawing from university (people)
2.0
178 1.7%
174 1.6% 140 1.3% 143 120 1.1% 1.2% 1.2%
1.0
140 120 100 80 60 40 20 0
132 1.3%
134 1.3%
144
1.5
Ratio of students withdrawing from university
Total number of students withdrawing from university Ratio of students withdrawing from university ※
0.5
0.0 2007 2008 2009 2010 2011 2012 2013 2014 (AY)
※ The percentage of students withdrawing from university is calculated by dividing the number of students who withdrew during that academic year by the total number of students as of May 1 of that particular academic year.
Undergraduate: Number of students withdrawing from university by reasons
200 180 160 140 120 100 80 60 40 36 20 0 37 29 7 8 41
loss of enthusiasm or will to study
Undergraduate: Number of students withdrawing from university (by Faculty)
(people)
200 180
178
11 27
174
2 31
acceptance to other university disqualified grades
167
160 140 120 100 80 60 40 20 0
42 29 28
173
27 5 22
178
174
Science and Technology Liberal Arts Comparative Culture Global Studies
17 16 26 26 21 14 16 10 30 2 27 17 21 12 12 5 26 7 13 6 15 16 9 26 7 15 12 9 16 9 23 31 29 1 25
28 22
132 3 134
7 15 19 31 26 24 7 23
140
143 144
2 3 26
further study job
11 18 29 5
140 134 132
16 19 2 22 27 25
143 144
16
120 33
10 12 20
illness death
120
28
6 2 12 9 51 4 3 5 7 21 4 3 17 6 7
32 26
33
20
3 22 3 7 6 1 1 42 17 5 28 7 71 2 3 4 12 3 7 35 1 16 3 9 10 3 11 19 7 6 16 1 3 6 4 2 3 41 38 32 33 34 42
39
Foreign Studies Economics Law Human Sciences Humanities Theology
expiry of enrollment period economic reasons unpaid tuition fees study abroad
22 18 18 2 26 23 24 19 1 39 25 6 33 1 39 7
6 3 5 1 7 22 5 2
15 13 8
family matters personal reasons
25
23 24 3 5
9 4 2 1 2 2007 2008 2009 2010 2011 2012 2013 2014 (AY) other reasons
4
2
6
2007 2008 2009 2010 2011 2012 2013 2014 (AY)
30
�
- ▲TOP
- ページ: 31
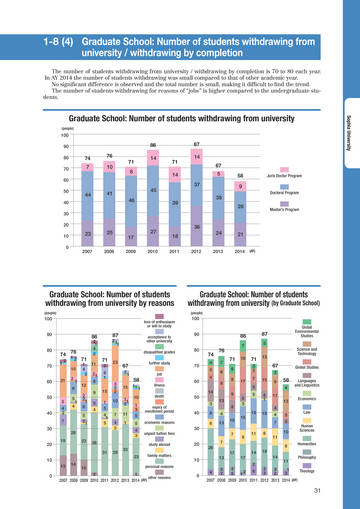
- 1-8 (4) Graduate School: Number of students withdrawing from university / withdrawing by completion
The number of students withdrawing from university / withdrawing by completion is 70 to 80 each year. In AY 2014 the number of students withdrawing was small compared to that of other academic year. No significant difference is observed and the total number is small, making it difficult to find the trend. The number of students withdrawing for reasons of “jobs” is higher compared to the undergraduate students.
Graduate School: Number of students withdrawing from university
(people)
Sophia University
100 90 80 70 60 50 40 30 20 10 0
86 74 7 76 10 71 8 45 46 39 14 71 14
87 14 67 5 37 38 28 58 9
Doctoral Program Juris Doctor Program
44
41
Master’s Program
23
2007
25
17
2009
27
36 18
2011 2012
24
21
2014
(AY)
2008
2010
2013
Graduate School: Number of students withdrawing from university by reasons
(people)
Graduate School: Number of students withdrawing from university (by Graduate School)
(people)
100 90 80 70 60 50 40 30 20 10
13 19
loss of enthusiasm or will to study
100 90 80 70 60 50
3
86 74 76
1 2 2 1 4 2
21 1
87
acceptance to other university disqualified grades
86 74
4 5 4 8 14 13 8 4 13 10 7
87
5
Global Environmental Studies Science and Technology
76
7 6
7
12
21
5 4 2 7
1 11 10 4 2 21 2 1 5 12 8 9 2 5 21 1 5 4 6 4 5 21
71
71 23
2 6 1 15 1 5 4 1 5 3 2 2 10 7 4 3
67
2 1
further study job
71
6 8 9
10
71
3 2
13
67
3 15 5 1 18 8 11 13 4 4 7 5 3 10 11 8
Global Studies
58
11 1
illness death expiry of enrollment period economic reasons unpaid tuition fees study abroad
17
7 5
58
4
15 11 2 11 1
Languages and Linguistics Economics Law Human Sciences Humanities Philosophy
10 1 3 5 5 4 3
5 3 15
5
40 30
8 6
16
28 23 38 31 14 10
9
11
6
20 10 0
7 26 13 4 3 2 17 17 2 14 18 14
29
33 23
family matters personal reasons
11
0
1 2 other reasons 2007 2008 2009 2010 2011 2012 2013 2014 (AY)
3 3 1 Theology 6 2 3 3 2 1 2007 2008 2009 2010 2011 2012 2013 2014 (AY)
4 2
31
�
- ▲TOP
- ページ: 32
- Sophia University
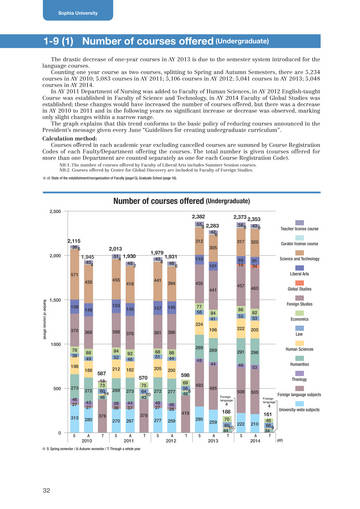
1-9 (1) Number of courses offered (Undergraduate)
The drastic decrease of one-year courses in AY 2013 is due to the semester system introduced for the language courses. Counting one year course as two courses, splitting to Spring and Autumn Semesters, there are 5,234 courses in AY 2010; 5,083 courses in AY 2011; 5,106 courses in AY 2012; 5,041 courses in AY 2013; 5,048 courses in AY 2014. In AY 2011 Department of Nursing was added to Faculty of Human Sciences, in AY 2012 English-taught Course was established in Faculty of Science and Technology, in AY 2014 Faculty of Global Studies was established; these changes would have increased the number of courses offered, but there was a decrease in AY 2010 to 2011 and in the following years no significant increase or decrease was observed, marking only slight changes within a narrow range. The graph explains that this trend conforms to the basic policy of reducing courses announced in the President’s message given every June “Guidelines for creating undergraduate curriculum”. Calculation method: Courses offered in each academic year excluding cancelled courses are summed by Course Registration Codes of each Faulty/Department offering the courses. The total number is given (courses offered for more than one Department are counted separately as one for each Course Registration Code).
NB:1. The number of courses offered by Faculty of Liberal Arts includes Summer Session courses. NB:2. Courses offered by Center for Global Discovery are included in Faculty of Foreign Studies.
※ cf. State of the establishment/reorganization of Faculty (page13), Graduate School (page 18).
Number of courses offered (Undergraduate)
2,500
2,382
558 2,283 42 6 312 305 110 101
2,373 2,353
56 8 317 43 6 320
Teacher license course Curator license course Science and Technology Liberal Arts
2,115
36 6 2,000
2,013 1,945
454 51 1,930 4 48 2 455
1,979
43 1,931 8 48 6
89 16
91 34
571 435
418
441
394
435 441
457
460
Global Studies Foreign Studies
1,500 159 148 153 145 157 145 77 56 224 370 1000 78 38 198 88 49 188 84 52 92 46 182 68 51 205 88 44 200 366 388 376 381 396 269 48 196 84 41 86 55 222 82 53 200
※ S: Spring semester / A: Autumn semester / T: Through a whole year
Number of courses offered
Economics Law Human Sciences Humanities Theology
269 44
291 46
296 53
587
212
500
273 46 27 313
272 43 27 280
A 2010
18 73 269 60 14 46 39 36 376 270
S
570
273 44 37 267
A 2011 T
598
69 56 8 46 493 495
Foreign language
75 272 64 10 43 49 27 378 277
S
277 46 28 259
A 2012
508 4
505
Foreign language
Foreign language subjects University-wide subjects
419 295 259
A 2013
188
70 6010 222 44 T S 210
A 2014
4
161
48 66 9 34 T
0
S
T
T
S
(AY)
32
�
- ▲TOP
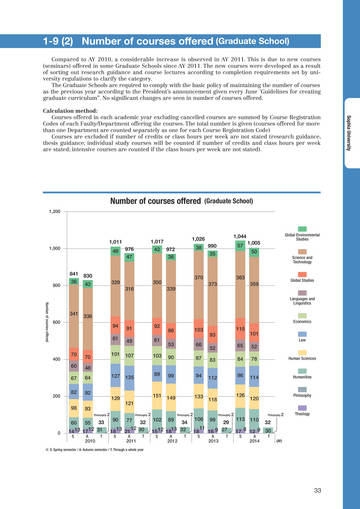
- ページ: 33
- 1-9 (2) Number of courses offered (Graduate School)
Compared to AY 2010, a considerable increase is observed in AY 2011. This is due to new courses (seminars) offered in some Graduate Schools since AY 2011. The new courses were developed as a result of sorting out research guidance and course lectures according to completion requirements set by university regulations to clarify the category. The Graduate Schools are required to comply with the basic policy of maintaining the number of courses as the previous year according to the President’s announcement given every June ’Guidelines for creating graduate curriculum”. No significant changes are seen in number of courses offered. Calculation method: Courses offered in each academic year excluding cancelled courses are summed by Course Registration Codes of each Faulty/Department offering the courses. The total number is given (courses offered for more than one Department are counted separately as one for each Course Registration Code) Courses are excluded if number of credits or class hours per week are not stated (research guidance, thesis guidance; individual study courses will be counted if number of credits and class hours per week are stated; intensive courses are counted if the class hours per week are not stated).
Sophia University
Number of courses offered (Graduate School)
1,200
1,011
1,000
1,017 976 47 42 972 36
1,026 38 990 35
1,044 57 1,005 50
Global Environmental Studies
49
Science and Technology
841
800
36
830 43 329 316 350 339
370 373
363 359
Global Studies
Languages and Linguistics
Number of courses offered
341
600
336 94 61 91 49 107 92 61 103 89 86 53 90 99 103 66 87 94 93 52 83 112 115 65 84 96 101
Economics
Law
52 78 114
Human Sciences
400
70 60 67
70 48 64 92 93
Philosophy 2
101
127
135
Humanities
200
82 98
129
151 121
Philosophy 2
149
Philosophy 2
133
118
Philosophy 2
126
120
Philosophy 2
Philosophy
0
33 60 55 12 13 31 14 17
S A 2010 T
90 18 13
S
32 12 30 21
A 2011 T
77
34 13 32 12 15 18
S A 2012 T
102
89
106 18 11
S
29 27 9 16
A 2013 T
99
32 8 9 30 12 17
S A 2014 T
(AY)
113
Theology
110
※ S: Spring semester / A: Autumn semester / T: Through a whole year
33
�
- ▲TOP
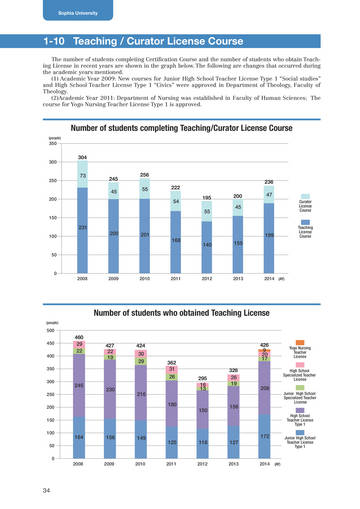
- ページ: 34
- Sophia University
1-10 Teaching / Curator License Course
The number of students completing Certification Course and the number of students who obtain Teaching License in recent years are shown in the graph below. The following are changes that occurred during the academic years mentioned. (1) Academic Year 2009: New courses for Junior High School Teacher License Type 1 “Social studies” and High School Teacher License Type 1 “Civics” were approved in Department of Theology, Faculty of Theology. (2)Academic Year 2011: Department of Nursing was established in Faculty of Human Sciences; The course for Yogo Nursing Teacher License Type 1 is approved.
Number of students completing Teaching/Curator License Course
(people)
350
300
304 73 256 55 222 54 195 55 200 45 236 47
Curator License Course
250
245 45
200
150
231
100
200
201
168
189 140 155
Teaching License Course
50
0
2008
2009
2010
2011
2012
2013
2014 (AY)
Number of students who obtained Teaching License
(people)
500 450 400 350 300 250 200 150 100 50 0 2008 2009 2010 2011 2012 2013 2014
(AY)
460 29 22
427 22 19
424 30 29 362 31 26 295 16 13
426 9 20 17 328 26 19
Yogo Nursing Teacher License High School Specialized Teacher License
245
230
216 180
208
150
156
Junior High School Specialized Teacher License High School Teacher License Type 1
164
156
149
172 125 116 127
Junior High School Teacher License Type 1
34
�
- ▲TOP
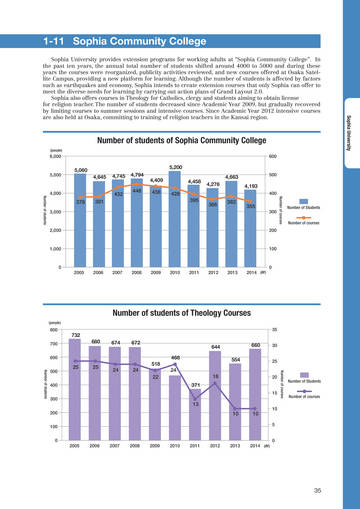
- ページ: 35
- 1-11 Sophia Community College
Sophia University provides extension programs for working adults at “Sophia Community College”. In the past ten years, the annual total number of students shifted around 4000 to 5000 and during these years the courses were reorganized, publicity activities reviewed, and new courses offered at Osaka Satellite Campus, providing a new platform for learning. Although the number of students is affected by factors such as earthquakes and economy, Sophia intends to create extension courses that only Sophia can offer to meet the diverse needs for learning by carrying out action plans of Grand Layout 2.0. Sophia also offers courses in Theology for Catholics, clergy and students aiming to obtain license for religion teacher. The number of students decreased since Academic Year 2009, but gradually recovered by limiting courses to summer sessions and intensive courses. Since Academic Year 2012 intensive courses are also held at Osaka, committing to training of religion teachers in the Kansai region.
Sophia University
Number of students of Sophia Community College
(people)
6,000
600
5,000
5,060 4,645
5,200 4,745 432 4,794 448 4,409 438 428 395 366 382 355 4,458 4,663 4,276 4,193
400
Number of courses
500
4,000
Number of students Number of students
378
3,000
381
300
Number of Students Number of courses
2,000
200
1,000
100
0
2005
2006
2007
2008
2009
2010
2011
2012
2013
2014 (AY)
0
Number of students of Theology Courses
(people)
800 700 600 500 400 300 200 100 0
732 680 674 672 468 25 25 518 24 24 22 371 24 18 644 554 660
35 30 25
Number of courses
20 15
Number of Students Number of courses
13 10 10
10 5 0
2005
2006
2007
2008
2009
2010
2011
2012
2013
2014 (AY)
35
�
- ▲TOP
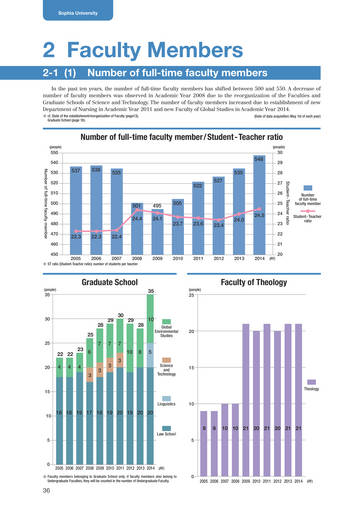
- ページ: 36
- Sophia University
2 Faculty Members
2-1 (1) Number of full-time faculty members
In the past ten years, the number of full-time faculty members has shifted between 500 and 550. A decrease of number of faculty members was observed in Academic Year 2008 due to the reorganization of the Faculties and Graduate Schools of Science and Technology. The number of faculty members increased due to establishment of new Department of Nursing in Academic Year 2011 and new Faculty of Global Studies in Academic Year 2014.
※ cf. State of the establishment/reorganization of Faculty (page13), Graduate School (page 18). (Date of data acquisition: May 1st of each year)
Number of full-time faculty member / Student - Teacher ratio
(people) (people)
550 540 530 520 510 500 490 480 470 460 450 2005 2006 2007 2008 2009 2010 2011 2012 2013 2014
(AY)
30
548 537 538 535 522 505 24.0 24.5 527 535
29 28 27 26
Student - Teacher ratio
※ ST ratio (Student-Teacher ratio): number of students per teacher
※ Faculty members belonging to Graduate School only; if faculty members also belong to Undergraduate Faculties, they will be counted in the number of Undergraduate Faculty.
36
Number of full-time faculty member
501 24.4 22.3 22.3 22.4
495 24.1
25 24 23 22 21 20
Number of full-time faculty member Student- Teacher ratio
23.7
23.6
23.4
Graduate School
(people)
Faculty of Theology
35
(people)
35
25
30
28 25
25
29
30
29
28
10
Global Environmental Studies
20
23 6 22 22
20
7
7
7 10 8 5
Science and Technology
4
4
4 3
3
3
3
15
15
Linguistics
Theology
10
10
18 18 19 17 18 19 20 19 20 20 9
5
Law School
9
10 10 21 20 21 20 21 21
5
0
2005 2006 2007 2008 2009 2010 2011 2012 2013 2014 (AY) 0 2005 2006 2007 2008 2009 2010 2011 2012 2013 2014 (AY)
�
- ▲TOP
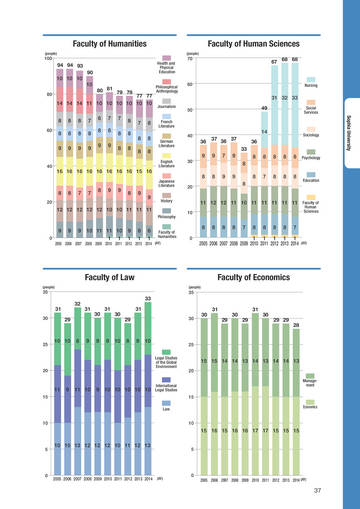
- ページ: 39
- Faculty of Humanities
100
(people) (people)
Faculty of Human Sciences
Health and Physical Education Philosophical Anthropology Journalism French Literature
70
94 94 93 10 10 10
80
67 68 68
90 10 80 81 79 79
60
Nursing
77 77 14 14 14 11 10 10 10 10 10 10 8 8 8 9 8 8 9 7 8 9 6 8 9 7 8 9 7 8 8 8 8 8
31 32 33
50
49
Social Services
Sophia University
7 8 8
8 8 8
60
8 9
40
German Literature
14 36 9 37 36 37 33 9 7 9 8 8 8 9 9 8 8 7 8 8 8 36 8 8 8 8 8
Sociology
40
English Literature
30
Psychology
16 16 16 16 16 16 16 16 15 16 8 9 9
Japanese Literature
Education
20
8
20
8
7
7
8
9
9
History
11 12 12 11 10 11 11 11 11 11 Faculty of
10
Human Sciences
12 12 12 12 12 10 10 11 11 11
Philosophy
9
0
9
9
2005 2006 2007 2008 2009 2010 2011 2012 2013 2014 (AY)
10 11 11 10 1 1
9 1
8 1
6 1
Faculty of Humanities
8
0
8
8
8
7
8 1
8 1
8 1
8 1
7 1
(AY)
2005 2006 2007 2008 2009 2010 2011 2012 2013 2014
Faculty of Law
(people)
Faculty of Economics
(people)
35
35
31
30
32 29
33 31 30 31 30 31 29
30
30
31 29
30
31 29
30
29 29
28
25
10 10
8
9
9
9
10
8
9
10
Legal Studies of the Global Environment
25
15 15 14 14 13 14 13 14 14 13
20
Management
20
11
15
9
11 10
9
10 10 10 10 10 Legal Studies
15
Law
International
Economics
10
10
15 16 15 16 16 17 17 15 15 15 10 10 13 12 12 12 10 11 12 13
5
5
0
2005 2006 2007 2008 2009 2010 2011 2012 2013 2014
(AY)
0
2005 2006 2007 2008 2009 2010 2011 2012 2013 2014 (AY)
37
�
- ▲TOP
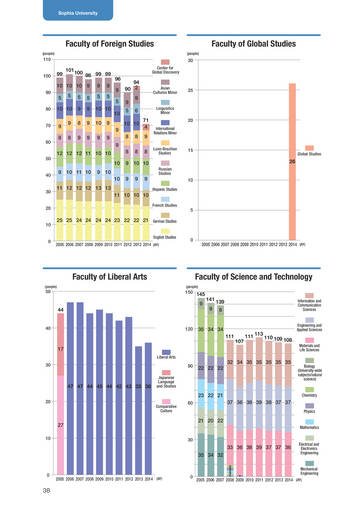
- ページ: 40
- Sophia University
Faculty of Foreign Studies
(people) (people)
Faculty of Global Studies
30
110
100
99
101100
98 99 99 9 5 9 5
Center for Global Discovery
96 9 5 10 9
10 10 10 9
90
94 90 2 9 5 9 6 71 4 9 8
5
5
5 9 8 9
Asian Cultures Minor
25
5 9 9 9
80
10 10 9 8 9 8
10 10 10 9 9 9
Linguistics Minor
70
10 10 8 9 8 10 8 8
20
International Relations Minor
60
50
12 12 12 11 10 10 9 10 11 10 9 10 10 11 12 12 12 13 13
Luso-Brazilian Studies
15
Global Studies
9 10 10
Russian Studies
26
40
9
9
9
Hispanic Studies
10
30
11 10 10 10
French Studies
20
5
10
25 25 24 24 24 24 23 22 22 21 German Studies
English Studies
0
2005 2006 2007 2008 2009 2010 2011 2012 2013 2014 (AY)
0
2005 2006 2007 2008 2009 2010 2011 2012 2013 2014 (AY)
Faculty of Liberal Arts
(people)
Faculty of Science and Technology
(people)
50
150
145 9
141 139 9 8
44
Information and Communication Sciences
40
120
35 34 34 111 107
111 113
Engineering and Applied Sciences
110 109 108
Materials and Life Sciences
17
Liberal Arts
30
Japanese Language and Studies
90
32 34 35 35 35 35 35 22 22 22
Biology (University-wide subjects/natural science)
47 47 44 45 44 42 43 35 36
20
23 22 21
Comparative Culture
Chemistry
60
37 36 38 39 38 37 37
Physics
27
10 30
21 20 22
Mathematics
33 36 38 39 37 37 36 35 34 32
2 2 2 2 1
Electrical and Electronics Engineering
0
2005 2006 2007 2008 2009 2010 2011 2012 2013 2014 (AY)
0
2005 2006 2007 2008 2009 2010 2011 2012 2013 2014 (AY)
1
Mechanical Engineering
38
�
- ▲TOP
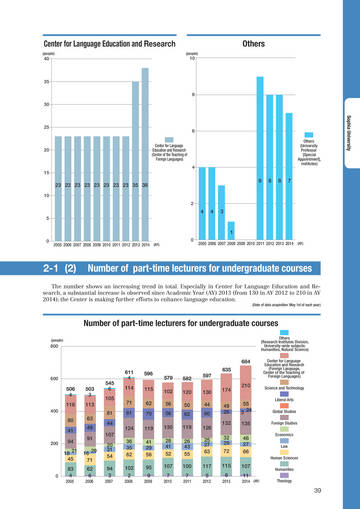
- ページ: 39
- Center for Language Education and Research
(people)
Others
(people)
40
10
35
8
30
Sophia University
25
6
Center for Language Education and Research (Center of the Teaching of Foreign Languages)
Others (University Professor [Special Appointment], institutes)
20
4
15
23 23 23 23 23 23 23 23 35 38
10
9
8
8
7
2
4
5
4
3
1
0 2005 2006 2007 2008 2009 2010 2011 2012 2013 2014 (AY)
0
2005 2006 2007 2008 2009 2010 2011 2012 2013 2014 (AY)
2-1 (2)
Number of part-time lecturers for undergraduate courses
The number shows an increasing trend in total. Especially in Center for Language Education and Research, a substantial increase is observed since Academic Year (AY) 2013 (from 130 in AY 2012 to 210 in AY 2014); the Center is making further efforts to enhance language education.
(Date of data acquisition: May 1st of each year)
Number of part-time lecturers for undergraduate courses
(people)
800
Others (Research Institutes Division, University-wide subjects: Humanities, Natural Science)
684
600
506 4 116
400
503 3 113 63 49 91 16 29 71 62 6
2006
545 6 105 81 44 107 20 31 54 94 3
2007
611 4 114 71 61 124 36 35 62 102 2
2008
596 115 62 70 119 41 29 56 95 9
2009
579 102 56 56 130 28 41 52 107 7
2010
582 120 50 62 119 26 43 55 100 7
2011
597 130 44 60 126 25 27 63 117 5
2012
635 210 55 3 24 135 46 27 66 107 11
2014 (AY)
Center for Language Education and Research (Foreign Language, Center of the Teaching of Foreign Languages) Science and Technology Liberal Arts Global Studies Foreign Studies Economics Law Human Sciences
174 49 26 132 32 29 72 115 6
2013
80 41
200
94 18 21 45
0
83 4
2005
Humanities Theology
39
�
- ▲TOP
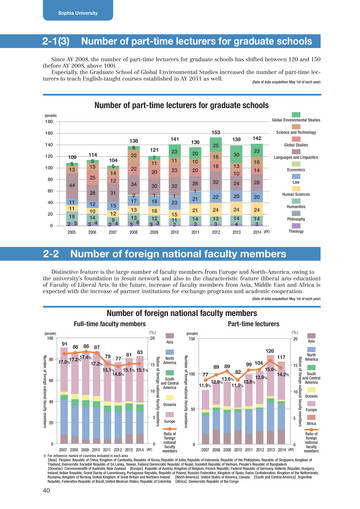
- ページ: 40
- Sophia University
2-1(3)
Number of part-time lecturers for graduate schools
Since AY 2008, the number of part-time lecturers for graduate schools has shifted between 120 and 150 (before AY 2008, above 100). Especially, the Graduate School of Global Environmental Studies increased the number of part-time lecturers to teach English-taught courses established in AY 2011 as well.
(Date of data acquisition: May 1st of each year)
Number of part-time lecturers for graduate schools
(people)
180 160 140 120 100 80 60 40 20 0
Global Environmental Studies
153 138 6 22 22 34 2 17 13 13 3 6
2008
Science and Technology
141 121 7 11 20 30 1 18 16 12 3 3
2009
136 20 10 20 26 1 21 21 14 3
2011
25 16 18 32 22 24 13 3
2012
139 30 13 10 24 20 24 14 4
2013
142
Global Studies
109 5 13 44
114 5 13 25 28
23 11 23 32 1 23 15 11 2
2010
23 16 14 28 20 24 14 3
2014 (AY)
Languages and Linguistics Economics Law Human Sciences Humanities Philosophy Theology
104 5 14 12 31 15 12 9 2 4
2007
11 11 18 2 5
2005
12 10 14 3 4
2006
2-2
Number of foreign national faculty members
Distinctive feature is the large number of faculty members from Europe and North-America, owing to the university’s foundation in Jesuit network and also to the characteristic feature (liberal arts education) of Faculty of Liberal Arts. In the future, increase of faculty members from Asia, Middle East and Africa is expected with the increase of partner institutions for exchange programs and academic cooperation.
(Date of data acquisition: May 1st of each year)
Number of foreign national faculty members
Full-time faculty members
(people) (%)
Part-time lecturers
20
(people) (%)
100
91
83 79 77 81 17.4% 80 17.2 % 17.0% 17.2% 15 15.1% 15.1% 15.1% 14.6%
60 10 40 5
86
86
87
Asia
150
20
Asia North America
126
North America
89
100
89
99 104 82
117 15.6%
15
Number of foreign national faculty members
Number of foreign national faculty members
Ration of foreign national faculty members
Ration of foreign national faculty members
South and Central America
13.9% 13.6% 12.9% 13.8% 11.9% 11.9%
77
14.2%
10
South and Central America Oceania Europe Africa Ratio of foreign national faculty members
Oceania
50 5
20
Europe Ratio of foreign national faculty members
0 2007 2008 2009 2010 2011 2012 2013 2014 (AY)
0
0
0 2007 2008 2009 2010 2011 2012 2013 2014 (AY)
※ For reference: names of countries included in each area 【Asia】Peoples’ Republic of China, Kingdom of Cambodia, Republic of Korea, Republic of India, Republic of Indonesia, Republic of the Philippines, Republic of Singapore, Kingdom of Thailand, Democratic Socialist Republic of Sri Lanka, Taiwan, Federal Democratic Republic of Nepal, Socialist Republic of Vietnam, People’s Republic of Bangladesh 【Oceania】Commonwealth of Australia, New Zealand 【Europe】Republic of Austria, Kingdom of Belgium, French Republic, Federal Republic of Germany, Hellenic Republic, Hungary, Ireland, Italian Republic, Grand Duchy of Luxembourg, Portuguese Republic, Republic of Poland, Russian Federation, Kingdom of Spain, Swiss Confederation, Kingdom of the Netherlands, Romania, Kingdom of Norway, United Kingdom of Great Britain and Northern Ireland 【North America】United States of America, Canada 【South and Central America】Argentine Republic, Federative Republic of Brazil, United Mexican States, Republic of Colombia 【Africa】Democratic Republic of the Congo
40
�
- ▲TOP
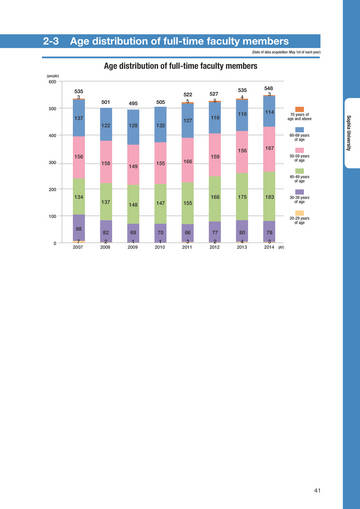
- ページ: 41
- 2-3
Age distribution of full-time faculty members
(Date of data acquisition:May 1st of each year)
Age distribution of full-time faculty members
(people)
600
535 3
500
501
495
505
522 5
527 5 116
535 4 116
548 3 114
137 122
400
128
132
127
70 years of age and above
Sophia University
60-69 years of age
156 156
300
167
50-59 years of age
158
149
155
166
159
40-49 years of age
200
134
137
168 148 147 155
175
183
30-39 years of age
100
20-29 years of age
98
0
82 2
2008
69 1
2009
70 1
2010
66 3
2011
77 2
2012
80 4
2013
78 3
2014 (AY)
7
2007
41
�
- ▲TOP
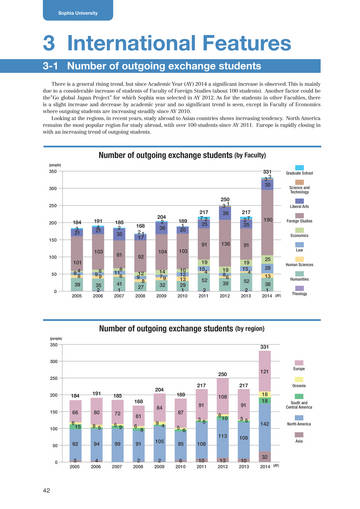
- ページ: 42
- Sophia University
3 International Features
3-1 Number of outgoing exchange students
There is a general rising trend, but since Academic Year (AY) 2014 a significant increase is observed. This is mainly due to a considerable increase of students of Faculty of Foreign Studies (about 100 students). Another factor could be the”Go global Japan Project” for which Sophia was selected in AY 2012. As for the students in other Faculties, there is a slight increase and decrease by academic year and no significant trend is seen, except in Faculty of Economics where outgoing students are increasing steadily since AY 2010. Looking at the regions, in recent years, study abroad to Asian countries shows increasing tendency. North America remains the most popular region for study abroad, with over 100 students since AY 2011. Europe is rapidly closing in with an increasing trend of outgoing students.
Number of outgoing exchange students (by Faculty)
(people)
350
300
331 33 30 250 31 184 3 21 191 4 21 185 2 35 204 2 36 189 1 20 217 72 25 38 217 27 25 190
Graduate School Science and Technology Liberal Arts Foreign Studies Economics
250
200
150
168 21 17
91 103 101 84 8 39 8 99 35 2
2006
136
100
81 8 11 6 41 1
2007
92 12 9 8 27
2008
104
103 19 15 4 52 2
2011 2012
91 19 15 4 52 2
2013
Law
25 28 13 38 1
2014 (AY)
50
14 79 32
2009
0
10 12 13 29 1
2010
19 8 6 39
Human Sciences Humanities Theology
2005
Number of outgoing exchange students (by region)
(people)
350
331
300
250
250 204 168 84 61 6 8 9 4 105 87 5 35 6 108 10
2011
121 217
Europe
217 189 91 6 10 108
Oceania
200
184 66 6 15
191
185 72 5 9 99
91 3 5 108
18 18
150
80 8 5 94 4
2006
South and Central America
100
142
North America
113
50
92 5
2005
91 2
85 6
2010
Asia
0
2
2009
13
2012
10
2013
32
2014 (AY)
2007
2008
42
�
- ▲TOP
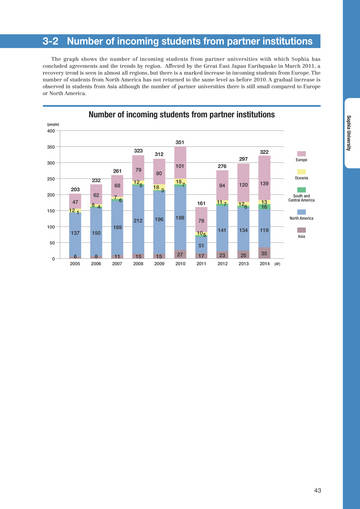
- ページ: 43
- 3-2 Number of incoming students from partner institutions
The graph shows the number of incoming students from partner universities with which Sophia has concluded agreements and the trends by region. Affected by the Great East Japan Earthquake in March 2011, a recovery trend is seen in almost all regions, but there is a marked increase in incoming students from Europe. The number of students from North America has not returned to the same level as before 2010. A gradual increase is observed in students from Asia although the number of partner universities there is still small compared to Europe or North America.
Number of incoming students from partner institutions
(people)
Sophia University
400 350 300
351 323 312 101 80 18 18 3 7 161 212 196 198 78 10 5 51 6
2005
322 297 276
Oceania Europe
261
250 200 150 100
79 12 5
232 203 47 12 1 62 8 4
68 7 6
94 11 7
120
139 13 16
South and Central America
12 6
North America
137
50 0
150
169
141
134
119
Asia
8
2006
11
2007
15
2008
15
2009
27
2010
17
2011
23
2012
25
2013
35
2014
(AY)
43
�
- ▲TOP
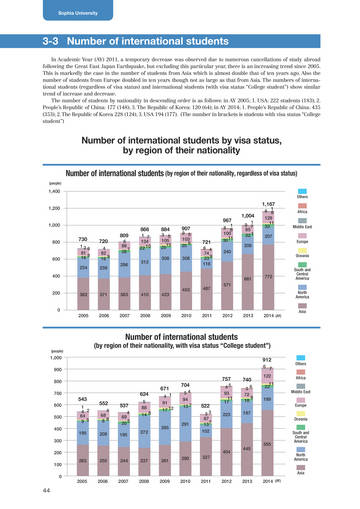
- ページ: 44
- Sophia University
3-3 Number of international students
In Academic Year (AY) 2011, a temporary decrease was observed due to numerous cancellations of study abroad following the Great East Japan Earthquake, but excluding this particular year, there is an increasing trend since 2005. This is markedly the case in the number of students from Asia which is almost double that of ten years ago. Also the number of students from Europe doubled in ten years though not as large as that from Asia. The numbers of international students (regardless of visa status) and international students (with visa status “College student”) show similar trend of increase and decrease. The number of students by nationality in descending order is as follows: in AY 2005; 1. USA: 222 students (183); 2. People’s Republic of China: 177 (148); 3. The Republic of Korea: 120 (64); in AY 2014; 1. People’s Republic of China: 435 (353); 2. The Republic of Korea 228 (124); 3. USA 194 (177). (The number in brackets is students with visa status “College student”)
Number of international students by visa status, by region of their nationality
Number of international students (by region of their nationality, regardless of visa status)
(people)
1,400
Others
1,200
1,167 967 1,004
1 9 7 85 32 1 208 6 1 8 129 11 33 207
Europe Oceania South and Central America North America Asia Africa Middle East
1,000
800
730
12 6 81 16 8 234
720
4 82 16 9 238
809
6 89 28 7 296
866
1 7 104 22 10 312
3 5 105 15 25 308
884
9 5 103 9 20 308
907
721
8 4 74 23 9 116
1 8 6 100 30 11 240
600
400 453 487 571
661 382 371 383 410 423
772
200
0 2005 2006 2007 2008 2009 2010 2011 2012 2013 2014 (AY)
(people)
(by region of their nationality, with visa status “College student”)
912
6 7 122 11 22
Middle East Others Africa
Number of international students
1,000 900 800 700
543
600 500 400 300 200 100 0 263 1 4 2 64 9 5 195
624 552
68 8 8 209 4
671
4 1 91 17 12
704
54 94 13 7
757
45 93 11 17 223
740
36 72 9 18 187
537
69 5 20 195 4
5 88 14 8
189
Europe Oceania South and Central America North America Asia
522
33 67 137 102
272
285
291
404 255 244 237 261 290 327
445
555
2005
2006
2007
2008
2009
2010
2011
2012
2013
2014 (AY)
44
�
- ▲TOP
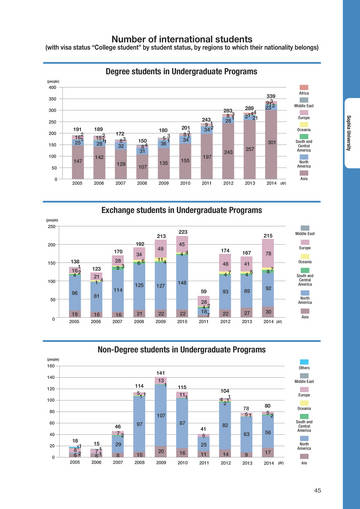
- ページ: 47
- (with visa status “College student” by student status, by regions to which their nationality belongs)
Number of international students
Degree students in Undergraduate Programs
(people)
400 350 300 250 200 150 100 50 0 2005 2006
191 2 161 25 147
189 2 15 1 28 1 142
172 83 32 129
150 84 31 107
2008
180 3 51 36
201 83 1 34
243 9 1 34 2
283 8 3 1 28
289 44 21 21
339 3 91 23 2
Africa Middle East Europe Oceania
Sophia University
301 197 243 257
South and Central America North America Asia
135
155
2007
2009
2010
2011
2012
2013
2014 (AY)
Exchange students in Undergraduate Programs
(people)
250
213
200
223 45 4 4 174 48 47 167 41 4 89 6
215 78
Middle East Europe Oceania
192 170 138 1 16 2 4 96 28 9 3 34 66
49 114
150
123 21 1 4
87 92
100
114 81 16
2006
125
127
148 59 28 42 18 7
2011
South and Central America North America
93
50
0
19
2005
16
2007
21
2008
22
2009
22
2010
22
2012
27
2013
30
2014 (AY)
Asia
Non-Degree students in Undergraduate Programs
(people)
160 140 120 100 80 60 40 20 0
114 5 1 1
141 13 1
Others Middle East
115 111
104 1 4 1 2
Europe
107 46 72 15 1 71 6
2006
78 51
80 5
Oceania
2
South and Central America North America Asia
97
87
18 11 8 62
2005
41 5 25 11
2011
82 63 56
29 8
2007
10
2008
20
2009
16
2010
14
2012
9
2013
17
2014 (AY)
45
�
- ▲TOP
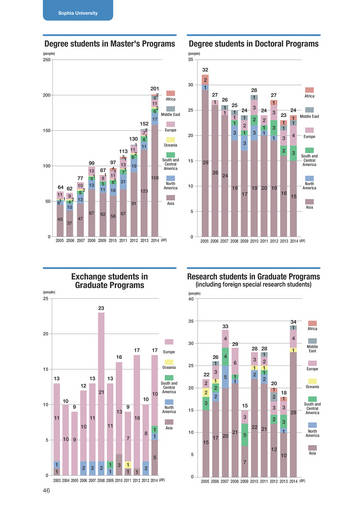
- ページ: 48
- Sophia University
Degree students in Master's Programs
(people)
Degree students in Doctoral Programs
(people)
250
35
32 201
200 2 5 11 2 6
Africa Middle East Europe
30
2 1 27 1 26 1 25 1 1 24 1 1 1 2 3 1 3
28 1 3 2 3 24 2 1 1
27 1 3 3 1 23 1 1 3 2 24
Africa
25
152
150
17
1 Middle East 1 4 3
Europe
130
100
99 77 64 62
11 9 1 2 13 61 4 10 45 37 47 10 2 5 13 1 5 13
1 11 Oceania 113 11 2 3 1 6 South and 97 13 Central 19 America 87 41 71 1 11 158 8 1 6 21 North 5 America 11 16 123 91
Asia
2 7 1 8
20
15
29 26 24 19 17 19 20 19 16
South and Central America
10
North America
50
15
Asia
67
62
58
67
5
0
2005 2006 2007 2008 2009 2010 2011 2012 2013 2014 (AY)
0
2005 2006 2007 2008 2009 2010 2011 2012 2013 2014 (AY)
(people)
Exchange students in Graduate Programs
23
Research students in Graduate Programs
(including foreign special research students)
(people)
25
40
35
20
33 4 26 1 22 3 1 2 2 15 3 4 6 5 1 1 29
34 1 4 28 28 1 3 2 1 1 2 1 2 1
Africa
30
17 16
15
17
Europe Oceania
Middle East
25
Europe
13 12
13 21
13 10
South and Central America North America
20
2 2 3
10
10 11
10 9 11 10 11 7 8 13 9 16
20 1 18 2 1 3 2 3 3 1 12 10 28
Oceania
15
South and Central America
5
10 9
1 1
Asia
10
15 5
5
17 20
21
5
22 21
North America
Asia
0
1 1
2
2
2
1 1
3
1 1
7
0
1
2
2005 2006 2007 2008 2009 2010 2011 2012 2013 2014 (AY)
2003 2004 2005 2006 2007 2008 2009 2010 2011 2012 2013 2014 (AY)
46
�
- ▲TOP
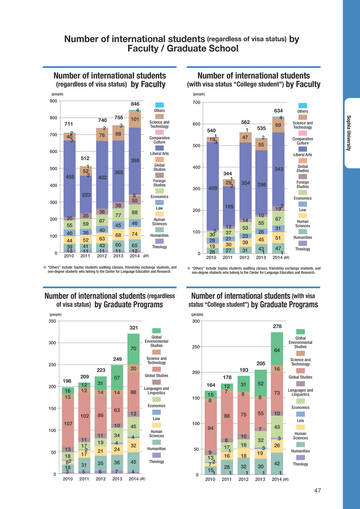
- ページ: 49
- Number of international students (regardless of visa status) by Faculty / Graduate School
Number of international students (regardless of visa status) by Faculty
(people)
(with visa status “College student”) by Faculty
(people)
Number of international students
900
846 4 711 740 2 76 755 3 88 101
700
Others Science and Technology Comparative Culture Liberal Arts
800
600
562 540 1 19 3 1 47
700
2 40 3 512
535 2 55
634 4 69
Others
Sophia University
Science and Technology Comparative Culture Liberal Arts
500
600
500
455
400
1 52 2
398 402 365
Global Studies Foreign Studies
400
300
409
344 1 29 2
343 354 298
Global Studies Foreign Studies Economics
223
300
38 20 55 40 44 39 13 35 59 36 52 41 11 36 67 40 63 43 11 77 45 68 60 11
8 50 88 46 74 65 12
Economics Law Human Sciences Humanities Theology
200
185 14 53 23 39 31
2012
2 19 10 55 26 45
2013
Law Human Sciences Humanities Theology
200
67 31 51 47 1
100
100
0
2010
2011
2012
2013
2014 (AY)
0
2010
5 30 28 19 26
12 37 21 30 27
2011
43 1
2014 (AY)
※ “Others” include Sophia students auditing classes, friendship exchange students, and non-degree students who belong to the Center for Language Education and Research.
※ “Others” include Sophia students auditing classes, friendship exchange students, and non-degree students who belong to the Center for Language Education and Research.
Number of international students (regardless of visa status) by Graduate Programs
(people)
Number of international students (with visa status “College student”) by Graduate Programs
(people)
350
300
321
300
Global Environmental Studies Science and Technology
278
Global Environmental Studies Science and Technology Global Studies
70 249
250
250
64 205 16
223 198 209 12 12 31 14 57 14 63 10 11 17 2 17 31 5
2011
20
Global Studies Languages and Linguistics
200
193 178 164 15 8 12 7 31 8 52 6 55 7 2011 8 17 1 16 28 1
2011
200
16 13
88
150
Economics
73
Languages and Linguistics Economics
150
102 107
100
86
13 45 4 32 45 4
2014 (AY)
Law Human Sciences Humanities Theology
88
100
75
10
Law
94 2010 10 2012 18 18 32 1
2012
43 3 2014 26 42 1
2014 (AY)
Human Sciences Humanities Theology
11 19 21 35 6
2012
50
0
13 18 82 18 3
2010
34 4 24 36 7
2013
2013 32 3 19 30 1
2013
50
0
9 13 2 7 15 1
2010
47
�
- ▲TOP
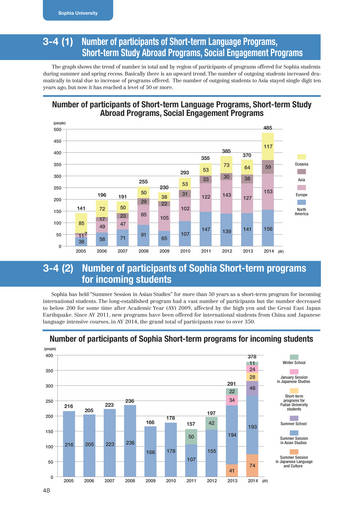
- ページ: 48
- Sophia University
3-4 (1) Number of participants of Short-term Language Programs, Short-term Study Abroad Programs, Social Engagement Programs
The graph shows the trend of number in total and by region of participants of programs offered for Sophia students during summer and spring recess. Basically there is an upward trend. The number of outgoing students increased dramatically in total due to increase of programs offered. The number of outgoing students to Asia stayed single digit ten years ago, but now it has reached a level of 50 or more.
Number of participants of Short-term Language Programs, Short-term Study Abroad Programs, Social Engagement Programs
(people)
500 450 400 350 300 250 200 150 100 50 0
485 117 370 64 38 153 127 59
Oceania Asia Europe North America
385 355 293 255 196 141 85 117 38
2005
53 33 122
73 30 143
191 50 23 47 71
2007
50 29 85
230 38 22 105
53 31 102
72 17 49 58
2006
91
2008
65
2009
107
2010
147
139
141
156
2011
2012
2013
2014 (AY)
3-4 (2) Number of participants of Sophia Short-term programs for incoming students
Sophia has held “Summer Session in Asian Studies” for more than 50 years as a short-term program for incoming international students. The long-established program had a vast number of participants but the number decreased to below 200 for some time after Academic Year (AY) 2009, affected by the high yen and the Great East Japan Earthquake. Since AY 2011, new programs have been offered for international students from China and Japanese language intensive courses, in AY 2014, the grand total of participants rose to over 350.
Number of participants of Sophia Short-term programs for incoming students
(people)
400 350 300 250 200
378 11 24 28 291 22 216 205 223 236 178 197 157 50 216 205 223 236 166 178 107 41 74
2014 (AY)
Winter School January Session in Japanese Studies Short-term programs for Fudan University students Summer School Summer Session in Asian Studies Summer Session in Japanese Language and Culture
48
34
166
150 100 50 0
42 194 155
193
2005
2006
2007
2008
2009
2010
2011
2012
2013
48
�
- ▲TOP
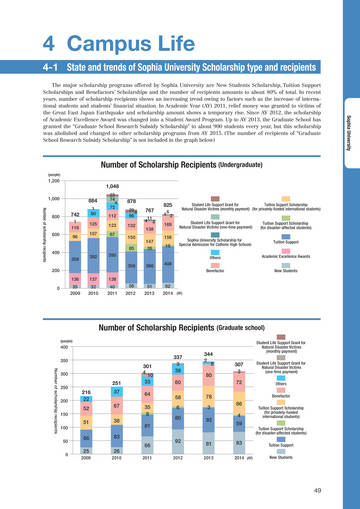
- ページ: 49
- 4 Campus Life
4-1 State and trends of Sophia University Scholarship type and recipients
The major scholarship programs offered by Sophia University are New Students Scholarship, Tuition Support Scholarships and Benefactors’ Scholarships and the number of recipients amounts to about 80% of total. In recent years, number of scholarship recipients shows an increasing trend owing to factors such as the increase of international students and students’ financial situation. In Academic Year (AY) 2011, relief money was granted to victims of the Great East Japan Earthquake and scholarship amount shows a temporary rise. Since AY 2012, the scholarship of Academic Excellence Award was changed into a Student Award Program. Up to AY 2013, the Graduate School has granted the “Graduate School Research Subsidy Scholarship” to about 900 students every year, but this scholarship was abolished and changed to other scholarship programs from AY 2015. (The number of recipients of “Graduate School Research Subsidy Scholarship” is not included in the graph below)
Sophia University
Number of Scholarship Recipients (Undergraduate)
(people)
1,200
1,048 884 742
1 116 96 1 90 125 107 23 74 4 72 112 123 67
1,000
Number of scholarship recipients
878
29 4 66 132 150 85
767
11 4 4 138 147 26
825
4 2 169 158 16 6
Student Life Support Grant for Tuition Support Scholarship Natural Disaster Victims (monthly payment) (for privately-funded international students) Student Life Support Grant for Natural Disaster Victims (one-time payment) Sophia University Scholarship for Special Admission for Catholic High Schools Others Tuition Support Scholarship (for disaster-affected students) Tuition Support Academic Excellence Awards New Students
800
600
400 358 200 136 0 35 2009
392
395 356 386 408
Benefactor
137 32 2010
138 40 2011 56 2012 51 2013 62 2014 (AY)
Number of Scholarship Recipients (Graduate school)
(people)
400 350
Number of scholarship recipients
300 250 200 150
251 216 22 52 51 37 67 38 83 26
2010
301 4 10 33 64 35 8 81
337 3 38 60 58 6 80
344 2 8 80
Student Life Support Grant for Natural Disaster Victims (monthly payment)
307 3 72
Student Life Support Grant for Natural Disaster Victims (one-time payment) Others Benefactor
78 3 92 86 4 59
Tuition Support Scholarship (for privately-funded international students) Tuition Support Scholarship (for disaster-affected students) Tuition Support New Students
100 50 0
66 25
2009
66
2011
92
2012
81
2013
83
2014 (AY)
49
�
- ▲TOP
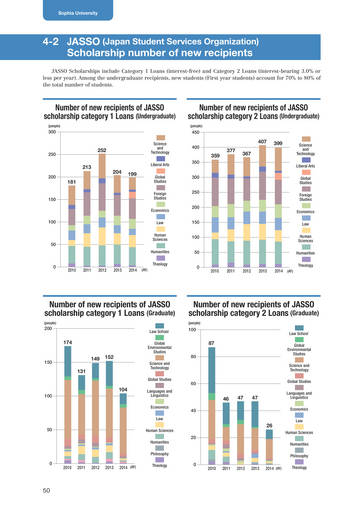
- ページ: 50
- Sophia University
4-2 JASSO (Japan Student Services Organization) Scholarship number of new recipients
JASSO Scholarships include Category 1 Loans (interest-free) and Category 2 Loans (interest-bearing 3.0% or less per year). Among the undergraduate recipients, new students (First year students) account for 70% to 80% of the total number of students.
Number of new recipients of JASSO scholarship category 1 Loans (Undergraduate)
(people)
Number of new recipients of JASSO scholarship category 2 Loans (Undergraduate)
(people)
300
Science and Technology Liberal Arts
450
407
400
399
250
252 213
359
350 300 250 200 150 100 50 0
377
367
Science and Technology Liberal Arts Global Studies Foreign Studies Economics Law Human Sciences Humanities Theology
200
204
199
181
Global Studies Foreign Studies Economics
150
100
Law Human Sciences Humanities
50
0
Theology
2010
2011
2012
2013
2014
(AY)
2010
2011
2012
2013
2014 (AY)
Number of new recipients of JASSO scholarship category 1 Loans (Graduate)
(people)
Number of new recipients of JASSO scholarship category 2 Loans (Graduate)
(people)
200
Law School
100
Law School
174 149 131 104
100
150
152
Global Environmental Studies Science and Technology Global Studies Languages and Linguistics Economics Law
87
80
Global Environmental Studies Science and Technology
60
Global Studies
46
40
47
47
Languages and Linguistics Economics Law Human Sciences Humanities Philosophy
50
Human Sciences Humanities Philosophy
26
20
0
2010
2011
2012
2013
2014 (AY)
Theology
0
2010
2011
2012
2013
2014 (AY)
Theology
50
�
- ▲TOP
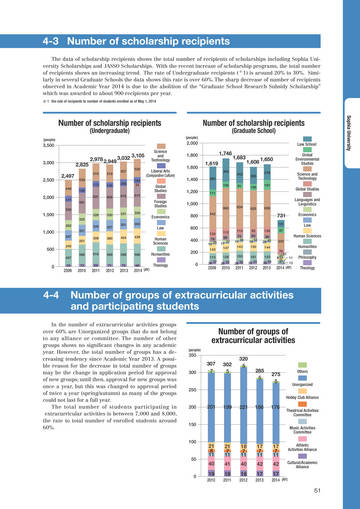
- ページ: 51
- 4-3 Number of scholarship recipients
The data of scholarship recipients shows the total number of recipients of scholarships including Sophia University Scholarships and JASSO Scholarships. With the recent increase of scholarship programs, the total number of recipients shows an increasing trend. The rate of Undergraduate recipients ( ※ 1) is around 20% to 30%. Similarly in several Graduate Schools the data shows this rate is over 60%. The sharp decrease of number of recipients observed in Academic Year 2014 is due to the abolition of the “Graduate School Research Subsidy Scholarship” which was awarded to about 900 recipients per year.
※1 the rate of recipients to number of students enrolled as of May 1, 2014
Sophia University
Number of scholarship recipients
(Undergraduate)
(people) (people)
Number of scholarship recipients
(Graduate School)
2,000
Law School
3,500
3,000
2,825 2,497
449 539
2,978 2,949 3,032
510 172 519 145 608 507 200 618
3,105
520 184 54 615
Science and Technology Liberal Arts (Comparative Culture) Global Studies Foreign Studies
1,800 1,600 1,400 1,200 1,000 800 600
134 542
1,746 1,619
383 380 105 111
1,683
342 91
1,608 1,650
283 106 259
Global Environmental Studies Science and Technology Global Studies Languages and Linguistics
2,500
161
160 631 591 326 325 330 327 380 331 301 329 300
2,000
177 530
663
634
625
608
1,500
292
Economics Law Human Sciences Humanities Theology
731
121 112 86 17 37 147 126 38 32 110 75 46 17 143 155 38 32 82 84 42 19 150 161 33 23 130 69 23 40 144 153 39 24 97
Economics Law Human Sciences
326 321 308
1,000
297 240 457
251
404
439
400 200 0
78 10 35 143 113 36 37
255
500
Humanities
76 21 9 45 11 37 47 12
566 72
616 89
569 71
598 73
596 68
Philosophy Theology
0
55
2009
2010
2011
2012
2013
2014 (AY)
2009
2010
2011
2012
2013
2014 (AY)
4-4
Number of groups of extracurricular activities and participating students
Number of groups of extracurricular activities
(people)
In the number of extracurricular activities groups over 60% are Unorganized groups that do not belong to any alliance or committee. The number of other groups shows no significant changes in any academic year. However, the total number of groups has a decreasing tendency since Academic Year 2013. A possible reason for the decrease in total number of groups may be the change in application period for approval of new groups; until then, approval for new groups was once a year, but this was changed to approval period of twice a year (spring/autumn) as many of the groups could not last for a full year. The total number of students participating in extracurricular activities is between 7,000 and 8,000, the rate to total number of enrolled students around 60%.
350
300
307 7
302 5
320 5
285 5
275 5
Others Unorganized Hobby Club Alliance
250
200
201
199
221
186
176
Theatrical Activities Committee Music Activities Committee
150
100
50
21 8 11 40 19
2010
21 7 11 41 18
2011
18 7 11 40 18
2012
17 7 11 42 17
2013
17 7 11 42 17
2014 (AY)
Athletic Activities Alliance Cultural/Academic Alliance
0
51
�
- ▲TOP
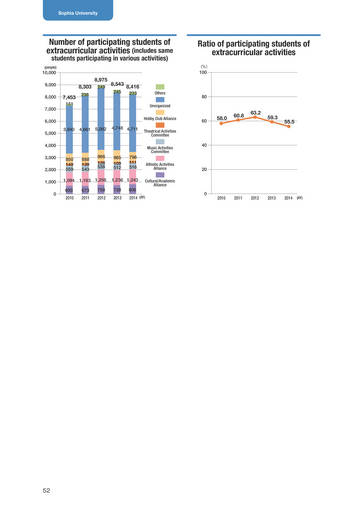
- ページ: 54
- Sophia University
Number of participating students of extracurricular activities (includes same
students participating in various activities)
8,975 8,303 7,453
151 236 249
(people)
Ratio of participating students of extracurricular activities
(%)
10,000 9,000 8,000 7,000 6,000 5,000 4,000 3,000 2,000 1,000 0 850 149 559 1,094 693 2010 888 139 543 1,163 673 2011 966 126 538 1,256 758 2012 965 109 512 796 111 516 3,940 4,661 5,082 4,748 4,711
100
8,543
245
8,416
233
Others Unorganized Hobby Club Alliance Theatrical Activities Committee Music Activities Committee Athletic Activities Alliance Cultural/Academic Alliance
80
60
58.0
60.8
63.2
59.3
55.5
40
20
1,236 1,243 728 2013 806
2014 (AY)
0
2010
2011
2012
2013
2014 (AY)
52
�
- ▲TOP
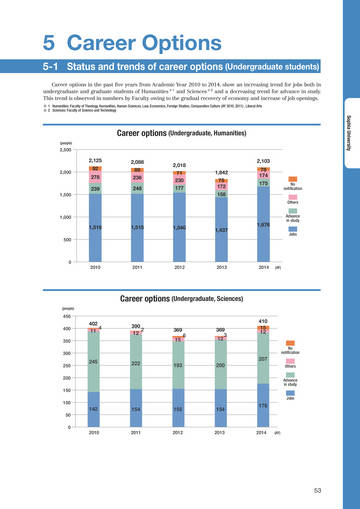
- ページ: 53
- 5 Career Options
5-1 Status and trends of career options (Undergraduate students)
Career options in the past five years from Academic Year 2010 to 2014, show an increasing trend for jobs both in undergraduate and graduate students of Humanities ※1 and Sciences ※2 and a decreasing trend for advance in study. This trend is observed in numbers by Faculty owing to the gradual recovery of economy and increase of job openings.
※ 1 Humanities: Faculty of Theology, Humanities, Human Sciences, Law, Economics, Foreign Studies, Comparative Culture (AY 2010, 2011) , Liberal Arts ※ 2 Sciences: Faculty of Science and Technology
Sophia University
Career options (Undergraduate, Humanities)
(people)
2,500
2,125
2,000
2,088 89 236 248
92 278 239
2,018 71 230 177 1,842 75 172 158
2,103 78 174 175
No notification Others
1,500
1,000
1,516
500
1,515
1,540
1,437
1,676
Advance in study Jobs
0
2010
2011
2012
2013
2014
(AY)
Career options (Undergraduate, Sciences)
(people)
450 400 350 300 250 200 150 100
402 4 11
390 2 12
369 15
6
369 3 12
410 15 12
No notification
245
222
207 193 200
Others Advance in study Jobs
142
50 0
154
155
154
176
2010
2011
2012
2013
2014
(AY)
53
�
- ▲TOP
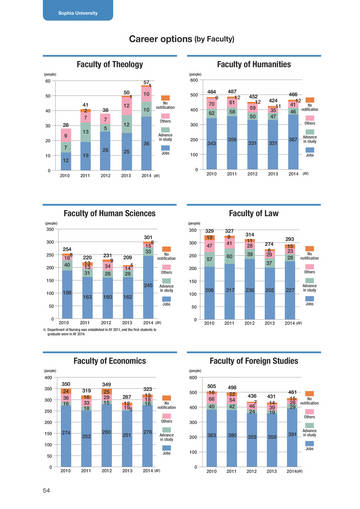
- ページ: 56
- Sophia University
Career options (by Faculty)
Faculty of Theology
(people) (people)
Faculty of Humanities
57 1
600 500
No notification Others Advance in study Jobs
60 50 40 30 20 10 0
50 41 2 7 28 9 7 12
2010
1
10 10
38 7 5
12
484 9 70 62
487 12 61 58
400 300 200 100 0
452 12 59 50
424 11 35 47
466 12 41 No 46 notification
Others Advance in study Jobs
12
13
36 19 26 25
343
356
331
331
367
2011
2012
2013
2014 (AY)
2010
2011
2012
2013
2014 (AY)
Faculty of Human Sciences
(people) (people)
Faculty of Law
350
350 300 250 200 150 100 50 0
254 8 18 40
220 13 13 31
231 9 34 28
209 5 14 28
301 8 15 33
300
No notification Others
329 19 47 57
327 9 41 60
314 11 28 39
250 200 150 100 50 0
274 6 29 37
293 15 23 28
No notification Others Advance in study Jobs
245 188 163 160 162
Advance in study Jobs
206
217
236
202
227
2010
2011
2012
2013
2014 (AY)
2010
2011
2012
2013
2014 (AY)
※ Department of Nursing was established in AY 2011, and the first students to graduate were in AY 2014.
Faculty of Economics
(people)
(people)
Faculty of Foreign Studies
600
400 350 300 250 200 150 100 50 0 2010 2011 2012 2013 2014 (AY)
Jobs
350 24 36 16
319 16 33 18
349 25 29 15
287 12 195
323 13 18 16
500
No notification Others
400 300 200 100 0
505 16 66 40
498 22 54 42
436 7 46 24
431 14 39 19
461 15 No 26 notification 29
Others Advance in study Jobs
274
252
280
251
276
Advance in study
383
380
359
359
391
2010
2011
2012
2013
2014(AY)
54
�
- ▲TOP
- ページ: 55
- Faculty of Liberal Arts
(people)
Faculty of Science and Technology
(people)
250
500
200
150
167 14 29 17
191 14 26 25
198 7 27 16
167 26 24 10
202 14 41 13
No notification Others Advance in study
400
402 11 4
390 12 2
369 6 15 193
369 3 12 200
410 15 12
No notification
300
245
222
207
Others
100
200
Sophia University
50
107
126
148 107
134
Jobs
Advance in study
100
142
154
155
154
176
Jobs
0
2010
2011
2012
2013
2014 (AY)
0
2010
2011
2012
2013
2014 (AY)
5-2 Career options (Graduate students)
Career options in the five years from Academic Year 2010 to 2014, show a decreasing trend for jobs in Master’s Program students of Humanities ※1. The percentage of advance study remains around 10%, that of other options on the increase. Other options include preparing for study abroad, preparing for certification examinations, continuing with job search, overseas travel, and part-time jobs. For the Master’s Program students of Sciences ※ 2 the numbers vary slightly but remains around 90% for jobs, less than 5% for advance study. There is no graph for the Doctoral Program students as a high percentage of the students do not notify their career options making it difficult to grasp the trend statistically.
(Master’s Program, Humanities)
(people) (people)
Career Options
(Master’s Program, Sciences)
250
Career Options
250
217
200
222 32 208 27
200 21 43
20 40
211 28
No notification
200
194 1 52
216 3 8 10
43
208 4
204 3 57
48 41
150
52
57
150
Others
171 No 10 notification 5 4
Others Advance in study
30
100
39
32
32
Advance in study Jobs
100
186
195
197
189 152
50
106
116 103 97 94
Jobs
50
0
2010
2011
2012
2013
2014 (AY)
0
2010
2011
2012
2013
2014
(AY)
※ 1 Humanities: Graduate School of Theology, Philosophy, Humanities, Human Sciences, Law, Economics, Languages and Linguistics, Global Studies, Global Environmental Studies ※ 2 Sciences: Graduate School of Science and Technology
55
�
- ▲TOP
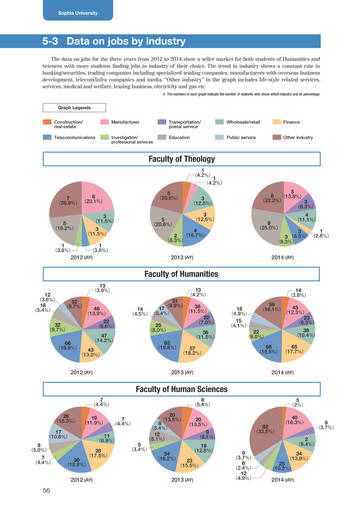
- ページ: 56
- Sophia University
5-3 Data on jobs by industry
The data on jobs for the three years from 2012 to 2014 show a seller market for both students of Humanities and Sciences with more students finding jobs in industry of their choice. The trend in industry shows a constant rate in banking/securities, trading companies including specialized trading companies, manufacturers with overseas business development, telecom/infra companies and media. “Other industry” in the graph includes life-style related services, services, medical and welfare, leasing business, electricity and gas etc.
※ The numbers in each graph indicate the number of students who chose which industry and its percentage.
Graph Legends Construction/ real estate Telecommunications Manufacturer Investigation/ professional services Transportation/ postal service Education Wholesale/retail Public service Finance Other industry
Faculty of Theology
(4.2%)
1
(4.2%)
1
6 7 (26.9%) (23.1%)
(11.5%) (11.5%) (3.8%)
(20.8%)
5
3 (12.5%)
(12.5%)
8 (13.9%) (22.2%) 3 (8.3%) 9 (25.0%)
(11.1%)
5
3
(19.2%)
5
3
5 (20.8%)
3
4
(3.8%)
1
1
4 2 (16.7%) (8.3%)
1 3 3 (8.3%) (2.8%) (8.3%)
2012 (AY)
2013 (AY)
2014 (AY)
Faculty of Humanities
12 (3.6%) 18 (5.4%)
(3.9%) (9.7%)
13
(4.2%)
13
32
46 (13.9%)
(6.6%)
32 (9.7%)
(19.9%)
22
66
47 (14.2%)
(13.0%)
43
31 (9.9%) 36 17 14 (11.5%) (4.5%) (5.4%) 22 (7.0%) 25 (8.0%) 36 (11.5%) 62 (19.8%) 57 (18.2%)
(3.8%)
14
18 (4.9%) 15 (4.1%) 22
45 (16.1%) (12.3%)
59
(6.3%) (10.4%)
23
(6.0%)
38
(18.5%) (17.7%)
68
65
2012 (AY)
2013 (AY)
2014 (AY)
Faculty of Human Sciences
(4.4%) (16.3%) (10.6%)
7
(5.4%)
8
(2%) (16.3%)
5
26
(11.9%)
19
(4.4%)
7
17
8 (5.0%) 7 (4.4%)
(6.9%) (17.5%)
11
28
30 (18.8%)
20 (13.5%) 20 8 (13.5%) (5.4%) 9 12 (6.1%) (8.1%) 5 19 (3.4%) (12.8%) 24 (16.2%) 23 (15.5%)
40
82 (33.5%)
(3.7%)
9
(9.4%) (3.7%) (2.4%) (4.9%)
2
9 6
12
(10.2%)
25
(13.9%)
34
2012 (AY)
56
2013 (AY)
2014 (AY)
�
- ▲TOP
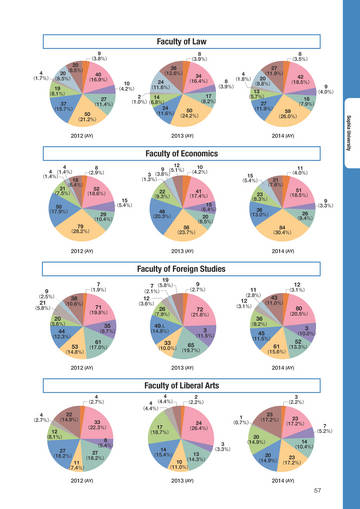
- ページ: 59
- Faculty of Law
(3.8%)
9
20 (8.5%) 4 20 40 (1.7%) (8.5%) (16.9%)
(8.1%)
(3.9%) (12.6%)
8
(3.5%)
8
26
19
10 (4.2%) 2
24 (11.6%) 14
(16.4%)
34
8 (3.9%)
4 (1.8%)
(8.8%)
20
(11.9%)
27
(18.5%)
42
37 (15.7%)
(11.4%)
27
(1.0%) (6.8%)
(8.2%) (24.2%)
17
50 (21.2%)
(11.6%)
24
50
13 (5.7%) 27 (11.9%)
(4.0%) (7.9%) (26.0%)
9
18
59
Sophia University
2012 (AY)
2013 (AY)
2014 (AY)
Faculty of Economics
4 8 4 (1.4%) (2.9%) (1.4%) 18 (6.4%) 21 52 (7.5%) (18.6%) 50 (17.9%) 79
(5.4%)
12 10 9 (5.1%) (4.2%) 3 (3.8%) (1.3%)
(9.3%)
15 (5.4%)
(4.0%) (7.6%)
11
21
22
15
(17.4%)
41
29 (10.4%)
(20.3%)
48
(28.2%)
(23.7%)
56
15 (6.4%) 20 (8.5%)
23 (8.3%)
(13.0%)
(18.5%)
51
36
(3.3%) (9.4%)
9
26
(30.4%)
84
2012 (AY)
2013 (AY)
2014 (AY)
Faculty of Foreign Studies
(2.5%) (5.8%)
9
(1.9%) (10.6%)
7
(2.1%) (3.6%)
19 7 (5.8%)
(2.7%)
9
21
38
12
(5.6%) (12.3%)
20
(19.8%)
71
(7.9%) (14.8%)
26
(21.8%)
72
(3.1%)
12
(2.8%)
11
(3.1%)
12
(11.0%)
43
44
(9.7%)
35
49人
(17.0%) (14.8%)
53
61
(11.5%)
3
(9.2%) (11.5%)
36
(20.5%)
80
45
(10.0%)
3
(10.0%)(19.7%)
33
65
(13.3%) (15.6%)
61
52
2012 (AY)
2013 (AY)
2014 (AY)
Faculty of Liberal Arts
(2.7%)
4
(2.7%)
4
(14.9%)
22
4 4 (4.4%) (4.4%) 17
(2.2%)
2
(2.2%)
3
12 (8.1%)
(18.2%)
33 (22.3%)
(5.4%)
(18.7%)
24 (26.4%)
(0.7%)
1
(17.2%)
23
(17.2%)
23
8
27
11 (7.4%)
(18.2%)
27
14 (15.4%)
13 (14.3%) 10 (11.0%)
3 (3.3%)
(14.9%)
20
(5.2%) (10.4%)
7
14
(14.9%) (17.2%)
20
23
2012 (AY)
2013 (AY)
2014 (AY)
57
�
- ▲TOP
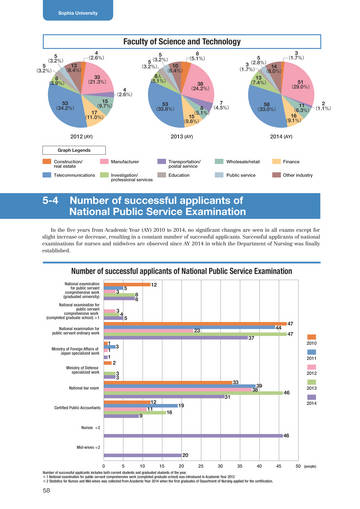
- ページ: 58
- Sophia University
Faculty of Science and Technology
(3.2%)
5
(3.2%)
5
(2.6%)
4
(8.4%)
13
(3.2%) (21.3%)
5
(3.2%) (6.4%)
5
(5.1%)
8
10
(3.9%)
6
33
8人 (5.1%) 4 (2.6%)
3 (1.7%) 5 3(2.8%) 14 (1.7%) (8.0%)
(7.4%)
38 (24.2%) 7 8 (4.5%) (5.1%) 15 (9.6%)
13
(29.0%)
51
(34.2%)
53
(9.7%) (11.0%)
15
17
(33.8%)
53
(33.0%)
58
(9.1%)
16
(6.3%) (1.1%)
11
2
2012 (AY)
Graph Legends Construction/ Construction/ real real estate estate Telecommunications Telecommunications Manufacturer Manufacturer Investigation/ Investigation/ professional professional services services
2013 (AY)
2014 (AY)
Transportation/ Transportation/ postal service service postal Education Education
Wholesale/retail Wholesale/retail Public service service Public
Finance Finance Other industry industry Other
5-4
Number of successful applicants of National Public Service Examination
In the five years from Academic Year (AY) 2010 to 2014, no significant changes are seen in all exams except for slight increase or decrease, resulting in a constant number of successful applicants. Successful applicants of national examinations for nurses and midwives are observed since AY 2014 in which the Department of Nursing was finally established.
Number of successful applicants of National Public Service Examination
National examination for public servant comprehensive work (graduated university) National examination for public servant comprehensive work (completed graduate school) ※1 National examination for public servant ordinary work
3
5 8 8 4 5
12
3
23 1 1 1 37 3 2 3 3
44
47 47
2010 2011 2012
Ministry of Foreign Affairs of Japan specialized work Ministry of Defense specialized work
33 31 19 16
National bar exam
39 38
46
2013 2014
Certified Public Accountants
12 11 9
Nurses
※2
46
Mid-wives ※2
20
0 5 10 15 20 25 30 35 40 45 50 (people)
Number of successful applicants includes both current students and graduated students of the year. ※ 1 National examination for public servant comprehensive work (completed graduate school) was introduced in Academic Year 2012 ※ 2 Statistics for Nurses and Mid-wives was collected from Academic Year 2014 when the first graduates of Department of Nursing applied for the certification.
58
�
- ▲TOP
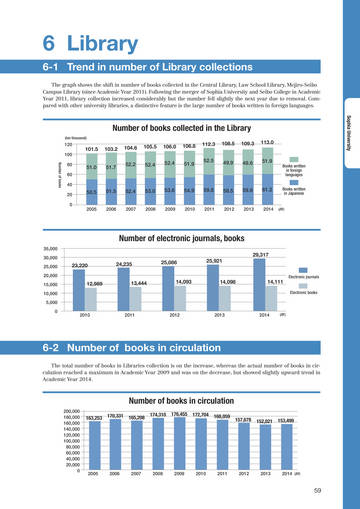
- ページ: 59
- 6 Library
6-1 Trend in number of Library collections
The graph shows the shift in number of books collected in the Central Library, Law School Library, Mejiro-Seibo Campus Library (since Academic Year 2011). Following the merger of Sophia University and Seibo College in Academic Year 2011, library collection increased considerably but the number fell slightly the next year due to removal. Compared with other university libraries, a distinctive feature is the large number of books written in foreign languages. Sophia University
Number of books collected in the Library
(ten thousand)
120 100 80 60 40 20 0
Number of books
101.5 51.0
103.2 51.7
104.6 52.2
105.5 52.4
106.0 52.4
106.8 51.9
112.3 52.5
108.5
109.3
113.0 51.9
49.9
49.6
Books written in foreign languages Books written in Japanese
50.5
2005
51.5
2006
52.4
2007
53.0
2008
53.6
54.9
2010
59.8
58.5
2012
59.8
61.2
2009
2011
2013
2014
(AY)
Number of electronic journals, books
35,000 30,000 25,000 20,000 15,000 10,000 5,000 0 2010 2011 2012 2013 2014
(AY)
23,220 12,989
24,235 13,444
25,086
25,921
29,317
14,093
14,098
14,111
Electronic journals
Electronic books
6-2 Number of books in circulation
The total number of books in Libraries collection is on the increase, whereas the actual number of books in circulation reached a maximum in Academic Year 2009 and was on the decrease, but showed slightly upward trend in Academic Year 2014.
Number of books in circulation
200,000 180,000 160,000 140,000 120,000 100,000 80,000 60,000 40,000 20,000 0
163,253
170,331
165,208
174,310
176,455
172,704
168,059
157,678
152,021
153,499
2005
2006
2007
2008
2009
2010
2011
2012
2013
2014 (AY)
59
�
- ▲TOP
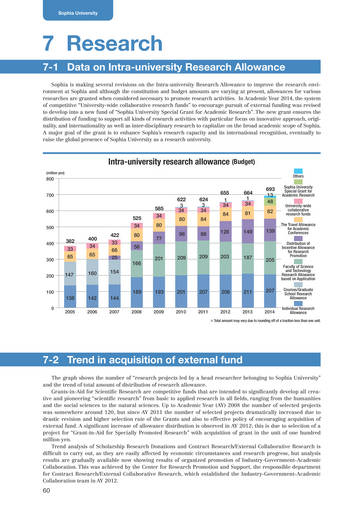
- ページ: 60
- Sophia University
7 Research
7-1 Data on Intra-university Research Allowance
Sophia is making several revisions on the Intra-university Research Allowance to improve the research environment at Sophia and although the constitution and budget amounts are varying at present, allowances for various researches are granted when considered necessary to promote research activities. In Academic Year 2014, the system of competitive “University-wide collaborative research funds” to encourage pursuit of external funding was revised to develop into a new fund of “Sophia University Special Grant for Academic Research”. The new grant ensures the distribution of funding to support all kinds of research activities with particular focus on innovative approach, originality, and internationality as well as inter-disciplinary research to capitalize on the broad academic scope of Sophia. A major goal of the grant is to enhance Sophia’s research capacity and its international recognition, eventually to raise the global presence of Sophia University as a research university.
Intra-university research allowance (Budget)
(million yen)
800 700 600 500 400 300 200 100
Others
525 34 382 33 65 147 400 34 65 160 422 33 66 25 154 80 56 166
585 34 80 77
622 3 34 80 96
624 3 34 84 88
655 1 34 84 128
664 1 34 81 149
693 13 48 82
Sophia University Special Grant for Academic Research University-wide collaborative research funds The Travel Allowance for Academic Conferences Distribution of Incentive Allowance for Research Promotion Faculty of Science and Technology Research Allowance based on Application
139
201
209
209
203
187
205
189 138 142
2006
193
201
207
206
211
207
144
2007 2008 2009 2010 2011 2012
※ Total amount may
Courses/Graduate School Research Allowance Individual Research Allowance
0
2005
2013
2014
vary due to rounding off of a traction less than one unit.
7-2 Trend in acquisition of external fund
The graph shows the number of “research projects led by a head researcher belonging to Sophia University” and the trend of total amount of distribution of research allowance. Grants-in-Aid for Scientific Research are competitive funds that are intended to significantly develop all creative and pioneering “scientific research” from basic to applied research in all fields, ranging from the humanities and the social sciences to the natural sciences. Up to Academic Year (AY) 2008 the number of selected projects was somewhere around 120, but since AY 2011 the number of selected projects dramatically increased due to drastic revision and higher selection rate of the Grants and also to effective policy of encouraging acquisition of external fund. A significant increase of allowance distribution is observed in AY 2012; this is due to selection of a project for “Grant-in-Aid for Specially Promoted Research” with acquisition of grant in the unit of one hundred million yen. Trend analysis of Scholarship Research Donations and Contract Research/External Collaborative Research is difficult to carry out, as they are easily affected by economic circumstances and research progress, but analysis results are gradually available now showing results of organized promotion of Industry-Government-Academic Collaboration. This was achieved by the Center for Research Promotion and Support, the responsible department for Contract Research/External Collaborative Research, which established the Industry-Government-Academic Collaboration team in AY 2012. 60
�
- ▲TOP
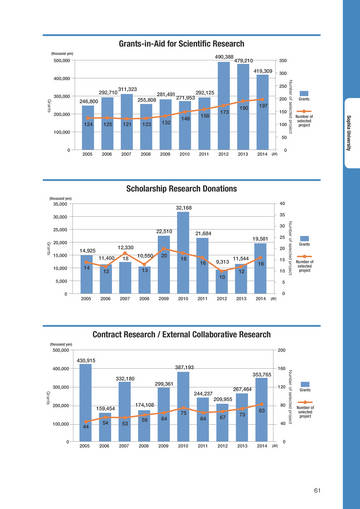
- ページ: 63
- Grants-in-Aid for Scientific Research
(thousand yen)
500,000
490,388
479,210 419,309
350 300
Number of selected project
400,000
300,000
Grants
292,710 246,800
311,323 255,808
250
281,491
271,953
292,125
200
Grants
200,000
124
100,000
125
121
123
132
148
158
173
190
197
150 100 50 0
Number of selected project
Sophia University
0
2005
2006
2007
2008
2009
2010
2011
2012
2013
2014 (AY)
Scholarship Research Donations
(thousand yen)
35,000 30,000 25,000 20,000 15,000 10,000 5,000 0
Grants
Grants
32,168
40 35
Number of selected project
22,510 12,330 11,400 14 12 18 10,550 13 20 18
30
21,684
19,581
25 20
Grants
14,925
16
9,313 10
11,544 12
16
15 10 5
Number of selected project
2005
2006
2007
2008
2009
2010
2011
2012
2013
2014
0
(AY)
Contract Research / External Collaborative Research
(thousand yen)
500,000
200
430,915
400,000
387,193 332,180 353,765 299,361 244,237 209,955 67 73 83 267,464
160
Number of selected project
300,000
120
Grants
200,000
159,454 44 54 53
174,108 59 64 75 64
80
Number of selected project
100,000
40
0
2005
2006
2007
2008
2009
2010
2011
2012
2013
2014
(AY)
0
61
�
- ▲TOP
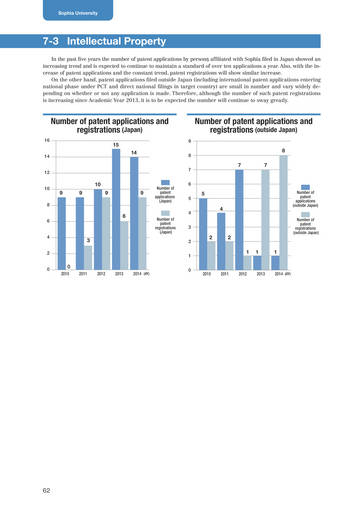
- ページ: 62
- Sophia University
7-3 Intellectual Property
In the past five years the number of patent applications by persons affiliated with Sophia filed in Japan showed an increasing trend and is expected to continue to maintain a standard of over ten applications a year. Also, with the increase of patent applications and the constant trend, patent registrations will show similar increase. On the other hand, patent applications filed outside Japan (including international patent applications entering national phase under PCT and direct national filings in target country) are small in number and vary widely depending on whether or not any application is made. Therefore, although the number of such patent registrations is increasing since Academic Year 2013, it is to be expected the number will continue to sway greatly.
Number of patent applications and registrations (Japan)
16 14 12 10 8 6 4 2 0
Number of patent applications and registrations (outside Japan)
9 8 7
15 14
8 7 7
10 9 9 9 9
Number of patent applications (Japan)
6 5 4
5 4
Number of patent applications (outside Japan) Number of patent registrations (outside Japan)
6
Number of patent registrations (Japan)
3 2 1
3
2
2 1 1 1
0
2010 2011 2012 2013 2014 (AY)
0
2010
2011
2012
2013
2014 (AY)
62
�
- ▲TOP
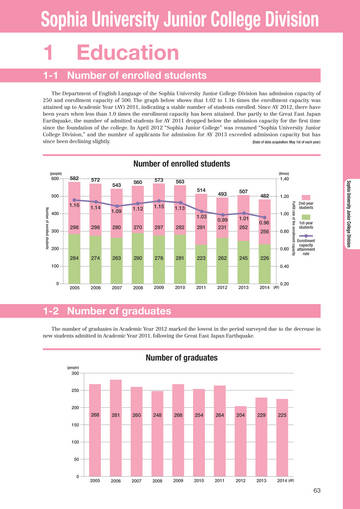
- ページ: 65
- Sophia University Junior College Division 1 Education
1-1 Number of enrolled students
The Department of English Language of the Sophia University Junior College Division has admission capacity of 250 and enrollment capacity of 500. The graph below shows that 1.02 to 1.16 times the enrollment capacity was attained up to Academic Year (AY) 2011, indicating a stable number of students enrolled. Since AY 2012, there have been years when less than 1.0 times the enrollment capacity has been attained. Due partly to the Great East Japan Earthquake, the number of admitted students for AY 2011 dropped below the admission capacity for the first time since the foundation of the college. In April 2012 “Sophia Junior College” was renamed “Sophia University Junior College Division,” and the number of applicants for admission for AY 2013 exceeded admission capacity but has since been declining slightly. (Date of data acquisition: May 1st of each year)
Number of enrolled students
(people)
600
582
(times)
572
543
560
573
563 514 493 507 482
1.40
Sophia University Junior College Division
500
1.20
2nd-year students 1st-year students Enrollment capacity attainment rate
Fulfill rate of the enrollment capacity
1.16
400
1.14
1.09 280
1.12 270
1.15
1.13 1.03 0.99 231 1.01 262 0.96 256
1-2 Number of graduates
The number of graduates in Academic Year 2012 marked the lowest in the period surveyed due to the decrease in new students admitted in Academic Year 2011, following the Great East Japan Earthquake.
Number of enrolled students
1.00
300
298
298
297
282
291
0.80
200
0.60
284
100
274
263
290
276
281
223
262
245
226
0.40
0
2005
2006
2007
2008
2009
2010
2011
2012
2013
2014 (AY)
0.20
Number of graduates
(people)
300
250
200
268
150
281
260
248
268
254
264
204
229
225
100
50
0
2005
2006
2007
2008
2009
2010
2011
2012
2013
2014 (AY)
63
�
- ▲TOP
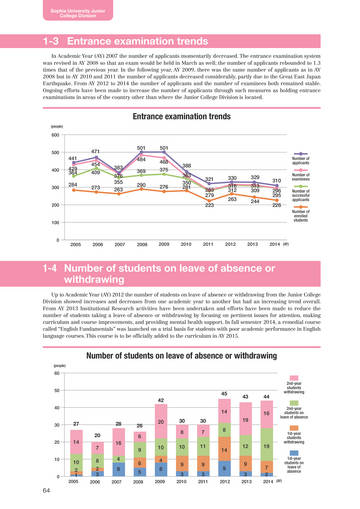
- ページ: 66
- Sophia University Junior College Division
1-3 Entrance examination trends
In Academic Year (AY) 2007 the number of applicants momentarily decreased. The entrance examination system was revised in AY 2008 so that an exam would be held in March as well; the number of applicants rebounded to 1.3 times that of the previous year. In the following year, AY 2009, there was the same number of applicants as in AY 2008 but in AY 2010 and 2011 the number of applicants decreased considerably, partly due to the Great East Japan Earthquake. From AY 2012 to 2014 the number of applicants and the number of examinees both remained stable. Ongoing efforts have been made to increase the number of applicants through such measures as holding entrance examinations in areas of the country other than where the Junior College Division is located.
Entrance examination trends
(people)
600
500
471 441 429 364 284 454 409 273 383 376 355 263
501 484 369 290
501 468 375 276 388 363 350 281 321 283 279 223 330 316 312 263 329 313 309 244 310 296 295 226
Number of applicants Number of examinees Number of successful applicants Number of enrolled students
400
300
200
100
0
2005
2006
2007
2008
2009
2010
2011
2012
2013
2014 (AY)
1-4 Number of students on leave of absence or withdrawing
Up to Academic Year (AY) 2012 the number of students on leave of absence or withdrawing from the Junior College Division showed increases and decreases from one academic year to another but had an increasing trend overall. From AY 2013 Institutional Research activities have been undertaken and efforts have been made to reduce the number of students taking a leave of absence or withdrawing by focusing on pertinent issues for attention, making curriculum and course improvements, and providing mental health support. In fall semester 2014, a remedial course called “English Fundamentals” was launched on a trial basis for students with poor academic performance in English language courses. This course is to be officially added to the curriculum in AY 2015.
Number of students on leave of absence or withdrawing
(people)
60
2nd-year students withdrawing
50
45 42 14 27 20 14 28 26 6 16 9 4 8
2007
43
44 16
40
30
20
30 8
30 7 11 9 3
2011 2012
19 8 12 9 3
2013
2nd-year students on leave of absence
20
7 8 2 3
2006
10 4 8
2009
10 9 3
2010
14 9
19
1st-year students withdrawing
10
10 2 1
2005
6 5
2008
0
7 2
2014 (AY)
1st-year students on leave of absence
64
�
- ▲TOP
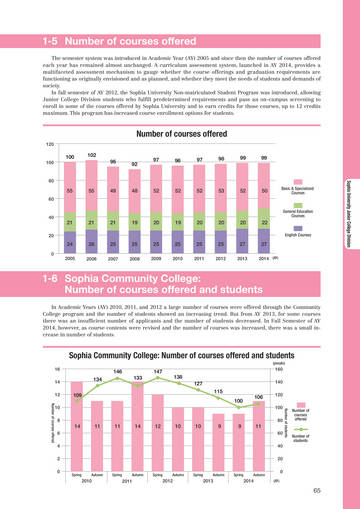
- ページ: 67
- 1-5 Number of courses offered
The semester system was introduced in Academic Year (AY) 2005 and since then the number of courses offered each year has remained almost unchanged. A curriculum assessment system, launched in AY 2014, provides a multifaceted assessment mechanism to gauge whether the course offerings and graduation requirements are functioning as originally envisioned and as planned, and whether they meet the needs of students and demands of society. In fall semester of AY 2012, the Sophia University Non-matriculated Student Program was introduced, allowing Junior College Division students who fulfill predetermined requirements and pass an on-campus screening to enroll in some of the courses offered by Sophia University and to earn credits for those courses, up to 12 credits maximum. This program has increased course enrollment options for students.
Number of courses offered
120 100
100
102 95 92
97
96
97
98
99
99
80
Sophia University Junior College Division
55
60
55
49
48
52
52
52
53
52
50
Basic & Specialized Courses
40
General Education Courses
21
21
21
19
20
19
20
20
20
22
English Courses
20
24
0 2005
26
2006
25
2007
25
2008
25
2009
25
2010
25
2011
25
2012
27
2013
27
2014 (AY)
1-6 Sophia Community College: Number of courses offered and students
In Academic Years (AY) 2010, 2011, and 2012 a large number of courses were offered through the Community College program and the number of students showed an increasing trend. But from AY 2013, for some courses there was an insufficient number of applicants and the number of students decreased. In Fall Semester of AY 2014, however, as course contents were revised and the number of courses was increased, there was a small increase in number of students.
Sophia Community College: Number of courses offered and students
(people)
16 14 12
Number of courses offered
146 134 109 133
147
160
138 127 115 100 106
140 120 100 80
Number of courses offered
Number of students
10 8
14
6 4 2 0
11
11
14
12
10
10
9
9
11
60 40 20 0
(AY)
Number of students
Spring
Autumn
Spring
Autumn
Spring
Autumn
Spring
Autumn
Spring
Autumn
2010
2011
2012
2013
2014
65
�
- ▲TOP
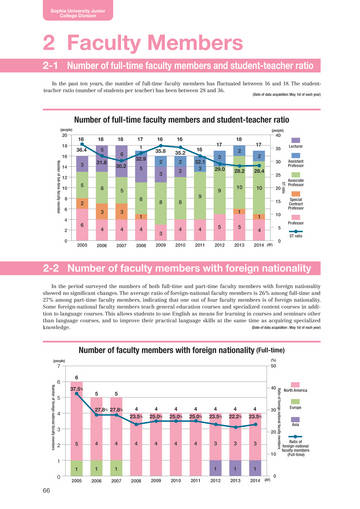
- ページ: 68
- Sophia University Junior College Division
2 Faculty Members
2-1 Number of full-time faculty members and student-teacher ratio
In the past ten years, the number of full-time faculty members has fluctuated between 16 and 18. The studentteacher ratio (number of students per teacher) has been between 28 and 36.
(Date of data acquisition: May 1st of each year)
Number of full-time faculty members and student-teacher ratio
(people)
20 18 16 14 12 10 8 6 4 2 0
(people)
16 36.4 3
18 5 31.8
18 6 30.2
17 1 32.9 5
16 35.8 2 3
16 35.2 2 2 16 32.1 3
17 3 29.0
18 2
40 35 30 25 20 15
17 2 28.4 10
Lecturer Assistant Professor Associate Professor Special Contract Professor Professor ST ratio
2-2 Number of faculty members with foreign nationality
In the period surveyed the numbers of both full-time and part-time faculty members with foreign nationality showed no significant changes. The average ratio of foreign-national faculty members is 26% among full-time and 27% among part-time faculty members, indicating that one out of four faculty members is of foreign nationality. Some foreign-national faculty members teach general education courses and specialized content courses in addition to language courses. This allows students to use English as means for learning in courses and seminars other than language courses, and to improve their practical language skills at the same time as acquiring specialized (Date of data acquisition : May 1st of each year) knowledge.
(people)
Number of full-time faculty member
28.2 10
ST ratio
5 2
6
5 6 8 8
9
9
3 6 4
2006
3 4
2007
1 4
2008
1 4
2010
1 4
2014 (AY)
10 5 0
3
2009
4
2011
5
2012
5
2013
2005
Number of faculty members with foreign nationality (Full-time)
(%)
7
50
6
Number of foreign national faculty members
6 37.5%
40
5 4 3 2 1
5
5 4 23.5% 4 25.0% 4 25.0% 4 25.0% 4 23.5% 4 22.2% 4 23.5%
30
North America
Ratio of foreign national faculty members
27.8% 27.8%
Europe
Asia
20
5
4
4
4
4
4
4
3
3
3
10
Ratio of foreign-national faculty members (Full-time)
1
0 2005
1
2006
1
2007 2008 2009 2010 2011
1
2012
1
2013
1
2014 (AY) 0
66
�
- ▲TOP
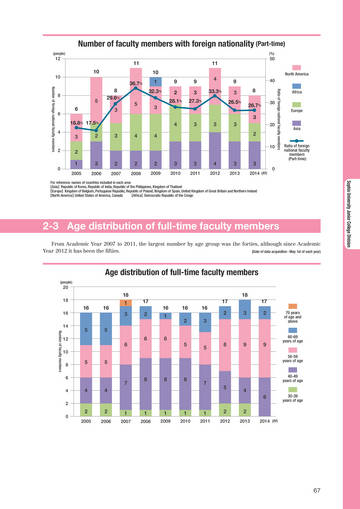
- ページ: 69
- Number of faculty members with foreign nationality (Part-time)
(people) (%)
12
11 10 36.7
%
11 10 1 32.3% 9 2 28.1% 3 4 3 3 9 3 27.3% 4 33.3% 9 3 26.5% 8 26.7% 3 3 2
50
North America
10
Number of foreign national faculty members
40
Ratio of foreign national faculty members
8
5 6 18.8% 17.5%
8 29.6% 3 5
Africa
30
6
Europe
20
4
Asia
3 2 1
2005
2
3
4
4
2
10
0
3
2006
2
2007
2
2008
2
2009
3
2010
3
2011
4
2012
3
2013
3
2014 (AY)
Ratio of foreign national faculty members (Part-time)
0
【Asia】Republic of Korea, Republic of India, Republic of the Philippines, Kingdom of Thailand 【Europe】Kingdom of Belgium, Portuguese Republic, Republic of Poland, Kingdom of Spain, United Kingdom of Great Britain and Northern Ireland United States of America, Canada 【North America】 【Africa】Democratic Republic of the Congo
For reference: names of countries included in each area
Sophia University Junior College Division
2-3 Age distribution of full-time faculty members
From Academic Year 2007 to 2011, the largest number by age group was the forties, although since Academic Year 2012 it has been the fifties. (Date of data acquisition : May 1st of each year)
Age distribution of full-time faculty members
(people)
20 18 16 14
Number of faculty members
18 16 16 1 3 5 5 6 6 5 5 8 8 8 6 5 5 8 17 16 2 1 16 2 16 3 17 2
18 17 3 2
70 years of age and above 60-69 years of age 50-59 years of age 40-49 years of age
12 10 8 6 4 2 0
9
9
7 4 4
7
5
4 6
30-39 years of age
2
2005
2
2006
1
2007
1
2008
1
2009
1
2010
1
2011
2
2012
2
2013 2014 (AY)
67
�
- ▲TOP
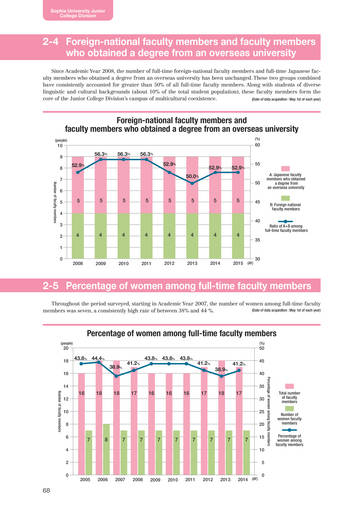
- ページ: 70
- Sophia University Junior College Division
2-4 Foreign-national faculty members and faculty members who obtained a degree from an overseas university
Since Academic Year 2008, the number of full-time foreign-national faculty members and full-time Japanese faculty members who obtained a degree from an overseas university has been unchanged. These two groups combined have consistently accounted for greater than 50% of all full-time faculty members. Along with students of diverse linguistic and cultural backgrounds (about 10% of the total student population), these faculty members form the core of the Junior College Division’s campus of multicultural coexistence. (Date of data acquisition : May 1st of each year)
Foreign-national faculty members and faculty members who obtained a degree from an overseas university
(people) (%)
10 9 8 7 6 5 4 3 2 1 0 2008 2009 2010 2011 2012 2013 2014 2015 (AY)
Number of faculty members
60
56.3% 52.9%
56.3%
56.3% 52.9% 50.0%
50
52.9%
52.9%
55
A: Japanese faculty members who obtained a degree from an overseas university
5
5
5
5
5
5
5
5
45
B: Foreign national faculty members
40
4
4
4
4
4
4
4
4
Ratio of A+B among full-time faculty members
35
30
2-5 Percentage of women among full-time faculty members
Throughout the period surveyed, starting in Academic Year 2007, the number of women among full-time faculty (Date of data acquisition : May 1st of each year) members was seven, a consistently high rate of between 38% and 44 %.
Percentage of women among full-time faculty members
(people)
20
50
(%)
18 16 14
43.8% 44.4% 38.9%
41.2%
43.8% 43.8% 43.8%
41.2% 38.9%
41.2%
45 40
Percentage of women among faculty members
35
16
12 10 8 6 4 2 0
18
18
17
16
16
16
17
18
17
30 25 20
Total number of faculty members Number of women faculty members Percentage of women among faculty members
Number of faculty members
7
8
7
7
7
7
7
7
7
7
15 10 5 0
2005
2006
2007
2008
2009
2010
2011
2012
2013
2014 (AY)
68
�
- ▲TOP
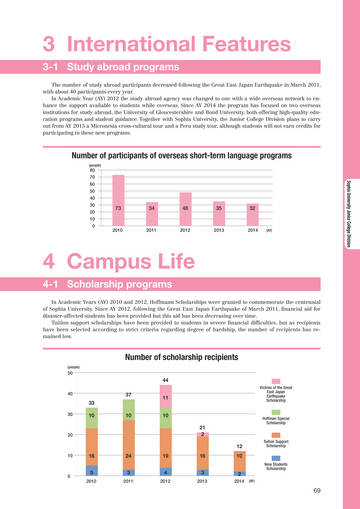
- ページ: 69
- 3 International Features
3-1 Study abroad programs
The number of study abroad participants decreased following the Great East Japan Earthquake in March 2011, with about 40 participants every year. In Academic Year (AY) 2012 the study abroad agency was changed to one with a wide overseas network to enhance the support available to students while overseas. Since AY 2014 the program has focused on two overseas institutions for study abroad, the University of Gloucestershire and Bond University, both offering high-quality education programs and student guidance. Together with Sophia University, the Junior College Division plans to carry out from AY 2015 a Micronesia cross-cultural tour and a Peru study tour, although students will not earn credits for participating in these new programs.
Number of participants of overseas short-term language programs
(people)
80 70 60 50 40 30 20 10 0
Sophia University Junior College Division
73
34
48
35
32
2010
2011
2012
2013
2014
(AY)
4 Campus Life
4-1 Scholarship programs
In Academic Years (AY) 2010 and 2012, Hoffmann Scholarships were granted to commemorate the centennial of Sophia University. Since AY 2012, following the Great East Japan Earthquake of March 2011, financial aid for disaster-affected students has been provided but this aid has been decreasing over time. Tuition support scholarships have been provided to students in severe financial difficulties, but as recipients have been selected according to strict criteria regarding degree of hardship, the number of recipients has remained low.
Number of scholarship recipients
(people)
50
44
40
37 33
11 10 21 2 12
Victims of the Great East Japan Earthquake Scholarship
30
10
10
Hoffman Special Scholarship
20
Tuition Support Scholarship
10
18 5
2010
24 3
2011
19 4
2012
16 3
2013
10 2
2014
(AY)
New Students Scholarship
0
69
�
- ▲TOP
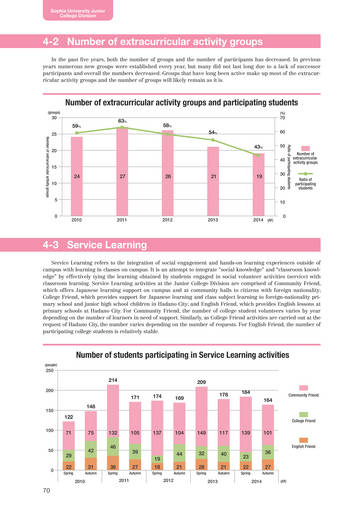
- ページ: 70
- Sophia University Junior College Division
4-2 Number of extracurricular activity groups
In the past five years, both the number of groups and the number of participants has decreased. In previous years numerous new groups were established every year, but many did not last long due to a lack of successor participants and overall the numbers decreased. Groups that have long been active make up most of the extracurricular activity groups and the number of groups will likely remain as it is.
Number of extracurricular activity groups and participating students
(groups)
30
59%
25 20 15
Number of extracurricular activity groups
63%
70
(%)
58% 54% 43%
60 50 40
Ratio of participating students
Number of extracurricular activity groups
24
10 5 0
27
26
21
19
30 20 10 0
Ratio of participating students
2010
2011
2012
2013
2014 (AY)
4-3 Service Learning
Service Learning refers to the integration of social engagement and hands-on learning experiences outside of campus with learning in classes on campus. It is an attempt to integrate “social knowledge” and “classroom knowledge” by effectively tying the learning obtained by students engaged in social volunteer activities (service) with classroom learning. Service Learning activities at the Junior College Division are comprised of Community Friend, which offers Japanese learning support on campus and at community halls to citizens with foreign nationality; College Friend, which provides support for Japanese learning and class subject learning to foreign-nationality primary school and junior high school children in Hadano City; and English Friend, which provides English lessons at primary schools at Hadano City. For Community Friend, the number of college student volunteers varies by year depending on the number of learners in need of support. Similarly, as College Friend activities are carried out at the request of Hadano City, the number varies depending on the number of requests. For English Friend, the number of participating college students is relatively stable.
Number of students participating in Service Learning activities
(people)
250
214
200
209 171 174 169 178 184 164
Community Friend
150
148 122
College Friend
100
71
75 42 31
Autumn
132 46
105
137
104
149
117
139
101
English Friend
50
29 22
Spring
39 19 27
Autumn
44 21
Autumn
32 28
Spring
40 21
Autumn
23 22
Spring
36 27
Autumn
0
36
Spring
18
Spring
2010
2011
2012
2013
2014
(AY)
70
�
- ▲TOP
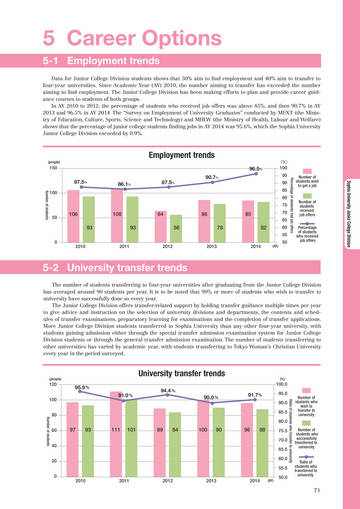
- ページ: 71
- 5 Career Options
5-1 Employment trends
Data for Junior College Division students shows that 50% aim to find employment and 40% aim to transfer to four-year universities. Since Academic Year (AY) 2010, the number aiming to transfer has exceeded the number aiming to find employment. The Junior College Division has been making efforts to plan and provide career guidance courses to students of both groups. In AY 2010 to 2012, the percentage of students who received job offers was above 85%, and then 90.7% in AY 2013 and 96.5% in AY 2014. The “Survey on Employment of University Graduates” conducted by MEXT (the Ministry of Education, Culture, Sports, Science and Technology) and MHLW (the Ministry of Health, Labour and Welfare) shows that the percentage of junior college students finding jobs in AY 2014 was 95.6%, which the Sophia University Junior College Division exceeded by 0.9%.
(people)
Employment trends
96.5% 87.5% 86.1% 87.5% 90.7
%
(%)
150
100 95 90 85 80 75
Number of students wish to get a job
Percentage of students had job offers
Sophia University Junior College Division
100
5-2 University transfer trends
The number of students transferring to four-year universities after graduating from the Junior College Division has averaged around 90 students per year. It is to be noted that 90% or more of students who wish to transfer to university have successfully done so every year. The Junior College Division offers transfer-related support by holding transfer guidance multiple times per year to give advice and instruction on the selection of university divisions and departments, the contents and schedules of transfer examinations, preparatory learning for examinations and the completion of transfer applications. More Junior College Division students transferred to Sophia University than any other four-year university, with students gaining admission either through the special transfer admission examination system for Junior College Division students or through the general transfer admission examination. The number of students transferring to other universities has varied by academic year, with students transferring to Tokyo Woman’s Christian University every year in the period surveyed.
Number of students
50
106 93
108 93
64 56
86 78
85 82
70 65 60 55 50
Number of students received job offers Percentage of students who received job offers
0
2010
2011
2012
2013
2014
(AY)
(people)
University transfer trends
95.9 % 91.0 % 94.4 % 90.0 % 91.7%
(%)
120 100 80 60 40 20 0
100.0 95.0
Ratio of students who transfer to university
90.0 85.5 80.0
Number of students who wish to transfer to university Number of students who successfully transferred to university Ratio of students who transferred to university
Number of students
97
93
111
101
89
84
100
90
96
88
75.5 70.0 65.5 60.0 55.5
2010
2011
2012
2013
2014
(AY)
50.0
71
�
- ▲TOP
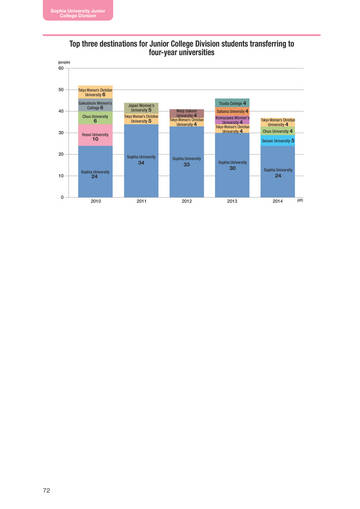
- ページ: 72
- Sophia University Junior College Division
Top three destinations for Junior College Division students transferring to four-year universities
(people)
60
50
Tokyo Woman’s Christian University 6 Gakushuin Women’s College 6 Chuo University Japan Women’s University 5 Tokyo Woman’s Christian University 5 Tsuda College 4 Meiji Gakuin University 4 Tokyo Woman’s Christian University 4 Saitama University 4 Komazawa Women's University 4 Tokyo Woman’s Christian University 4
40
6
Tokyo Woman’s Christian University 4 Chuo University 4 Seisen University 5
30
Hosei University
10
20
Sophia University
34
10
Sophia University
Sophia University
33
Sophia University
30
Sophia University
24
24
0
2010
2011
2012
2013
2014
(AY)
72
�
- ▲TOP
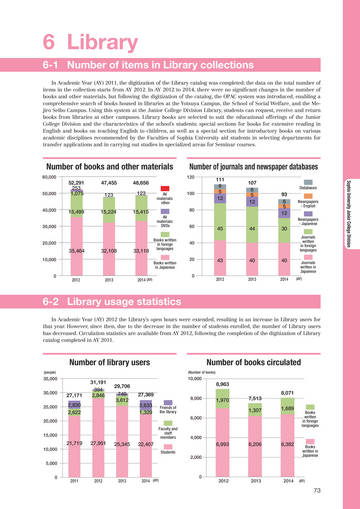
- ページ: 73
- 6 Library
6-1 Number of items in Library collections
In Academic Year (AY) 2011, the digitization of the Library catalog was completed; the data on the total number of items in the collection starts from AY 2012. In AY 2012 to 2014, there were no significant changes in the number of books and other materials, but following the digitization of the catalog, the OPAC system was introduced, enabling a comprehensive search of books housed in libraries at the Yotsuya Campus, the School of Social Welfare, and the Mejiro Seibo Campus. Using this system at the Junior College Division Library, students can request, receive and return books from libraries at other campuses. Library books are selected to suit the educational offerings of the Junior College Division and the characteristics of the school’s students; special sections for books for extensive reading in English and books on teaching English to children, as well as a special section for introductory books on various academic disciplines recommended by the Faculties of Sophia University aid students in selecting departments for transfer applications and in carrying out studies in specialized areas for Seminar courses.
Number of books and other materials
60,000 50,000 40,000 30,000 20,000
Number of journals and newspaper databases
120 100 80
52,291 253 1,075 15,499
47,455 123 15,224
48,656 123 15,415
AV materials: other AV materials: DVDs Books written in foreign languages Books written in Japanese
111 6 5 12
107 6 5 12
Sophia University Junior College Division
Databases
93 6 5 12 30
Newspapers - English Newspapers - Japanese Journals written in foreign languages
60 40 20 0
45
44
35,464
10,000 0
32,108
33,118
43
40
40
Journals written in Japanese
(AY)
2012
2013
2014 (AY)
2012
2013
2014
6-2 Library usage statistics
In Academic Year (AY) 2012 the Library’s open hours were extended, resulting in an increase in Library users for that year. However, since then, due to the decrease in the number of students enrolled, the number of Library users has decreased. Circulation statistics are available from AY 2012, following the completion of the digitization of Library catalog completed in AY 2011.
Number of library users
(people)
Number of books circulated
(Number of books)
35,000 30,000 25,000 20,000 15,000
27,171 2,830 2,622
31,191 394 2,846
10,000
29,706 749 3,612
8,963 1,970 7,513 1,307 8,071 1,689
27,369 3,633 1,329
Friends of the library
8,000
6,000
Faculty and staff members
Books written in foreign languages
4,000
21,719
10,000 5,000 0
27,951
25,345
22,407
Students
6,993
2,000
6,206
6,382
Books written in Japanese
2011
2012
2013
2014 (AY)
0
2012
2013
2014
(AY)
73
�
- ▲TOP
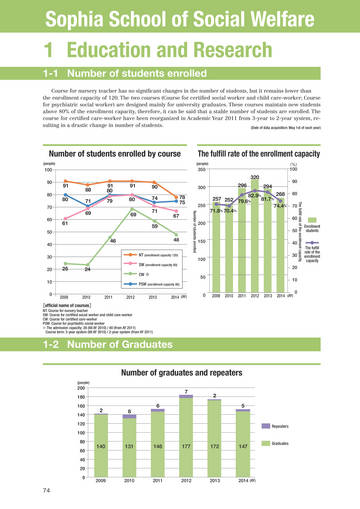
- ページ: 74
- Sophia School of Social Welfare 1 Education and Research
Sophia School of Social Welfare
1-1 Number of students enrolled
Course for nursery teacher has no significant changes in the number of students, but it remains lower than the enrollment capacity of 120. The two courses (Course for certified social worker and child care-worker; Course for psychiatric social worker) are designed mainly for university graduates. These courses maintain new students above 80% of the enrollment capacity, therefore, it can be said that a stable number of students are enrolled. The course for certified care-worker have been reorganized in Academic Year 2011 from 3-year to 2-year system, resulting in a drastic change in number of students. (Date of data acquisition: May 1st of each year)
Number of students enrolled by course
(people)
The fulfill rate of the enrollment capacity
(people) (%)
100 90 80 70
350
100 90 80
320 91 80 88 71 69 91 80 79 91 80 69 90 74 71 59 46
48
NT (enrollment capacity 120)
300
296
294
78 75
Number of students enrolled
60 50 40 30 20 10 0
67
268 82.9% 257 252 79.6% 81.7% 250 74.4% 71.8% 70.4%
200
The fulfill rate of the enrollment capacity
70 60 50
61
Enrollment students
150
40 30 20
100
25
24
SW (enrollment capacity 80) CW ※ PSW (enrollment capacity 80)
The fulfill rate of the enrollment capacity
50
10 2009 2010 2011 2012 2013 2014 (AY) 0
2009
2010
2011
2012
2013
2014 (AY)
0
[official name of courses]
NT: Course for nursery teacher SW: Course for certified social worker and child care-worker CW: Course for certified care-worker PSW: Course for psychiatric social worker ※ The admission capacity: 26 (till AY 2010) / 40 (from AY 2011) Course term: 3-year system (till AY 2010) / 2-year system (from AY 2011)
1-2 Number of Graduates
Number of graduates and repeaters
200 180 160 140 120 100 80 60 40 20 0 2009 2010 2011 2012 2013 2014 (AY)
(people)
7 2 6
2 5
8
Repeaters
140
131
146
177
172
147
Graduates
74
�
- ▲TOP
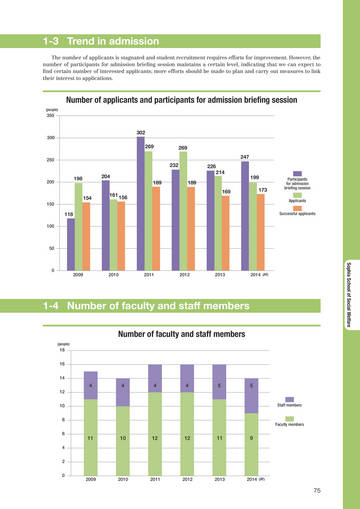
- ページ: 75
- 1-3 Trend in admission
The number of applicants is stagnated and student recruitment requires efforts for improvement. However, the number of participants for admission briefing session maintains a certain level, indicating that we can expect to find certain number of interested applicants; more efforts should be made to plan and carry out measures to link their interest to applications.
Number of applicants and participants for admission briefing session
(people)
350
300
302 269 269 247 232 198 204 189 154 161 156 189 169 226 214
250
200
199 173
Participants for admission briefing session Applicants Successful applicants
150
118
100
50
Sophia School of Social Welfare
0
2009
2010
2011
2012
2013
2014 (AY)
1-4 Number of faculty and staff members
Number of faculty and staff members
(people)
18 16 14
4
12 10 8 6 4 2 0
4
4
4
5
5
Staff members
Faculty members
11
10
12
12
11
9
2009
2010
2011
2012
2013
2014 (AY)
75
�
- ▲TOP
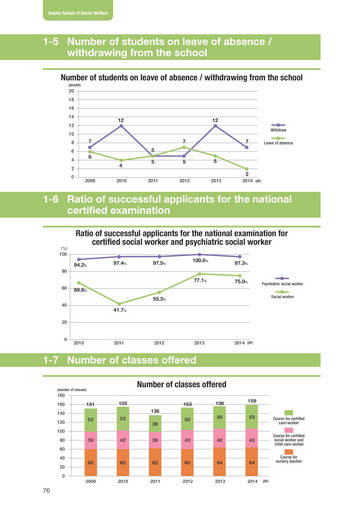
- ページ: 76
- Sophia School of Social Welfare
1-5 Number of students on leave of absence / withdrawing from the school
Number of students on leave of absence / withdrawing from the school
(people)
20 18 16 14 12 10 8 6 4 2 0 2009
12
12
Withdraw
7 5 6 4
2010
7
7
Leave of absence
5
5
5 2
2011
2012
2013
2014 (AY)
1-6 Ratio of successful applicants for the national certified examination
Ratio of successful applicants for the national examination for certified social worker and psychiatric social worker
94.2%
80
(%)
100
97.4%
97.5%
100.0%
97.3% 75.0%
77.1%
60
Psychiatric social worker Social worker
66.6% 55.3%
40
41.7%
20
0
2010
2011
2012
2013
2014 (AY)
1-7 Number of classes offered
(number of classes)
Number of classes offered
155 136 52 53 38 36 50 50 53
Course for certified care-worker Course for certified social worker and child care-worker Course for nursery teacher
180 160 140 120 100 80 60 40 20 0 2009 2010 2011 2012 2013 2014
(AY)
151
153
156
159
39
42
43
42
42
60
60
62
60
64
64
76
�
- ▲TOP
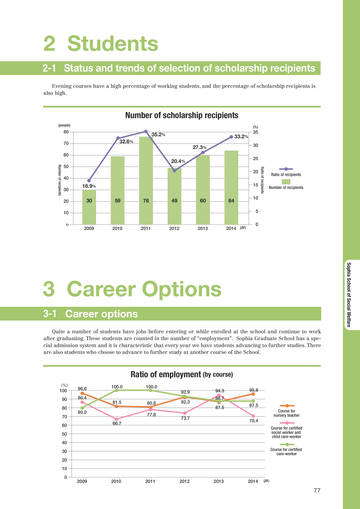
- ページ: 77
- 2 Students
2-1 Status and trends of selection of scholarship recipients
Evening courses have a high percentage of working students, and the percentage of scholarship recipients is also high.
Number of scholarship recipients
(people)
80 70 60 50 40 30 20 10
0
(%)
35.2% 32.6% 27.3% 20.4%
33.2%
35 30 25
Ratio of recipients
3 Career Options
3-1 Career options
Quite a number of students have jobs before entering or while enrolled at the school and continue to work after graduating. These students are counted in the number of “employment”. Sophia Graduate School has a special admission system and it is characteristic that every year we have students advancing to further studies. There are also students who choose to advance to further study at another course of the School.
Number of recipients
20
Ratio of recipients Number of recipients
16.9% 30 59 76 49 60 64
15 10 5 0
2009
2010
2011
2012
2013
2014 (AY)
Sophia School of Social Welfare
Ratio of employment (by course)
(%)
100 90 80 70 60 50 40 30 20 10 0
96.6 86.4 80.0
100.0 81.5
100.0 92.9 80.8 77.8 92.3 73.7
94.3 86.7 87.5
95.8 87.5
Course for nursery teacher
66.7
70.4
Course for certified social worker and child care-worker Course for certified care-worker
2009
2010
2011
2012
2013
2014
(AY)
77
�
- ▲TOP
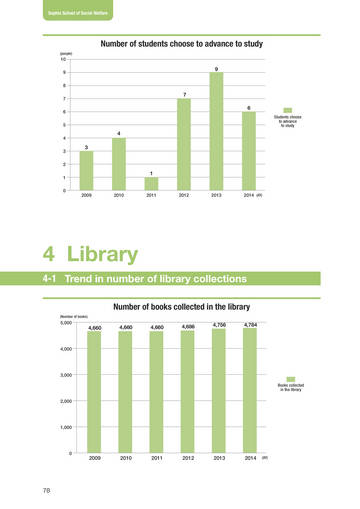
- ページ: 80
- Sophia School of Social Welfare
Number of students choose to advance to study
(people)
10 9 8 7 6 5 4 3 2 1 0
9
7 6
Students choose to advance to study
4 3
1
2009
2010
2011
2012
2013
2014 (AY)
4 Library
4-1 Trend in number of library collections
Number of books collected in the library
(Number of books)
5,000
4,660
4,660
4,660
4,686
4,756
4,784
4,000
3,000
Books collected in the library
2,000
1,000
0
2009
2010
2011
2012
2013
2014
(AY)
78
�
- ▲TOP
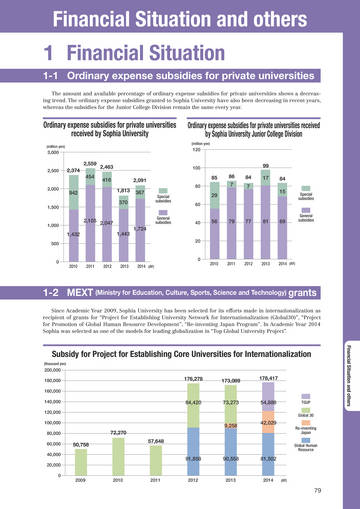
- ページ: 79
- Financial Situation and others 1 Financial Situation
1-1 Ordinary expense subsidies for private universities
The amount and available percentage of ordinary expense subsidies for private universities shows a decreasing trend. The ordinary expense subsidies granted to Sophia University have also been decreasing in recent years, whereas the subsidies for the Junior College Division remain the same every year.
Ordinary expense subsidies for private universities received by Sophia University
(million yen)
Ordinary expense subsidies for private universities received by Sophia University Junior College Division
(million yen)
3,000
120
2,559
2,500
2,374 454
2,463 416 1,813 370 2,091
100
99 85 86 7 29 84 7 17 84 15
Special subsidies
2,000
80
942
367
Special subsidies
1,500
60
1,000
2,105 2,047 1,432 1,443
General subsidies
40
56
79
77
81
69
General subsidies
1,724
20
500
0
0
2010 2011 2012 2013 2014 (AY)
2010
2011
2012
2013
2014 (AY)
1-2 MEXT (Ministry for Education, Culture, Sports, Science and Technology) grants
Since Academic Year 2009, Sophia University has been selected for its efforts made in internationalization as recipient of grants for “Project for Establishing University Network for Internationalization (Global30)”, “Project for Promotion of Global Human Resource Development”, “Re-inventing Japan Program”. In Academic Year 2014 Sophia was selected as one of the models for leading globalization in “Top Global University Project” . Financial Situation and others
Subsidy for Project for Establishing Core Universities for Internationalization
(thousand yen)
200,000 180,000 160,000 140,000 120,000 100,000 80,000 60,000 40,000 20,000 0 2009 2010 2011 2012 2013 2014
(AY)
176,278
173,089
178,417
84,420
73,273
54,886
TGUP Global 30
9,258 72,270 50,758 57,648 91,858 90,558
42,029
Re-inventing Japan Global Human Resource
81,502
79
�
- ▲TOP
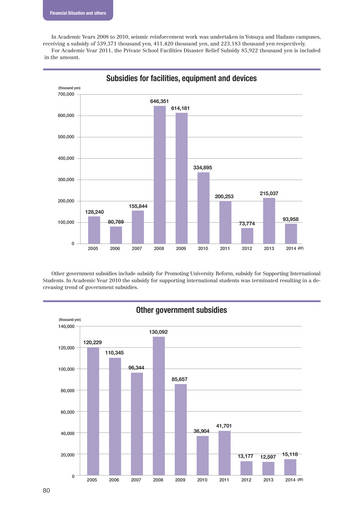
- ページ: 80
- Financial Situation and others
In Academic Years 2008 to 2010, seismic reinforcement work was undertaken in Yotsuya and Hadano campuses, receiving a subsidy of 539,371 thousand yen, 411,420 thousand yen, and 223,183 thousand yen respectively. For Academic Year 2011, the Private School Facilities Disaster Relief Subsidy 85,922 thousand yen is included in the amount.
Subsidies for facilities, equipment and devices
(thousand yen)
700,000
646,351 614,181
600,000
500,000
400,000
334,895
300,000
200,000
200,253 128,240 155,844 80,769 73,774
215,037
100,000
93,958
0
2005
2006
2007
2008
2009
2010
2011
2012
2013
2014 (AY)
Other government subsidies include subsidy for Promoting University Reform, subsidy for Supporting International Students. In Academic Year 2010 the subsidy for supporting international students was terminated resulting in a decreasing trend of government subsidies.
Other government subsidies
(thousand yen)
140,000
130,092 120,229 110,345 96,344 85,657
120,000
100,000
80,000
60,000
40,000
36,904
41,701
20,000
13,177
12,597
15,118
0
2005
2006
2007
2008
2009
2010
2011
2012
2013
2014 (AY)
80
�
- ▲TOP
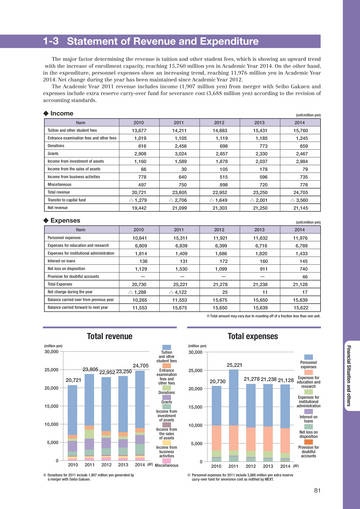
- ページ: 81
- 1-3 Statement of Revenue and Expenditure
The major factor determining the revenue is tuition and other student fees, which is showing an upward trend with the increase of enrollment capacity, reaching 15,760 million yen in Academic Year 2014. On the other hand, in the expenditure, personnel expenses show an increasing trend, reaching 11,976 million yen in Academic Year 2014. Net change during the year has been maintained since Academic Year 2012. The Academic Year 2011 revenue includes income (1,907 million yen) from merger with Seibo Gakuen and expenses include extra reserve carry-over fund for severance cost (3,688 million yen) according to the revision of accounting standards.
◆ Income
Item
Tuition and other student fees Entrance examination fees and other fees Donations Grants Income from investment of assets Income from the sales of assets Income from business activities Miscellaneous Total revenue Transfer to capital fund Net revenue
(unit:million yen)
2010
2011
2012
2013
2014
13,677 1,019 616 2,908 1,160 66 778 497 20,721 △ 1,279 19,442
14,211 1,105 2,456 3,024 1,589 30 640 750 23,805 △ 2,706 21,099
14,883 1,119 698 2,857 1,878 105 515 898 22,952 △ 1,649 21,303
15,431 1,185 773 2,330 2,037 178 596 720 23,250 △ 2,001 21,250
15,760 1,245 659 2,467 2,984 79 735 776 24,705 △ 3,560 21,145
(unit:million yen)
◆ Expenses
Item
Personnel expenses Expenses for education and research Expenses for institutional administration Interest on loans Net loss on disposition Provision for doubtful accounts Total Expenses Net change during the year Balance carried over from previous year Balance carried forward to next year
2010
2011
2012
2013
2014
10,841 6,809 1,814 136 1,129 ー 20,730 △ 1,288 10,265 11,553
15,311 6,839 1,409 131 1,530 ー 25,221 △ 4,122 11,553 15,675
11,921 6,399 1,686 172 1,099 ー 21,278 25 15,675 15,650
11,632 6,716 1,820 160 911 ー 21,238 11 15,650 15,639
11,976 6,789 1,433 145 740 46 21,128 17 15,639 15,622
※Total amount may vary due to rounding off of a fraction less than one unit.
Total revenue
(million yen)
Total expenses
(million yen)
Financial Situation and others
30,000
25,000
23,805 20,721
22,952 23,250
24,705
Tuition and other student fees Entrance examination fees and other fees Donations Grants Income from investment of assets Income from the sales of assets Income from business activities
30,000
25,000
25,221 20,730
Personnel expenses
21,278 21,238 21,128 Expenses for
20,000
20,000
education and research
15,000
15,000
Expenses for institutional administration Interest on loans Net loss on disposition
10,000
10,000
5,000
5,000
0
Provision for doubtful accounts
2010
2011
2012
2013
2014 (AY) Miscellaneous
0
2010
2011
2012
2013
2014 (AY)
※ Donations for 2011 include 1,907 million yen generated by a merger with Seibo Gakuen.
※ Personnel expenses for 2011 include 3,688 million yen extra reserve carry-over fund for severance cost as notified by MEXT.
81
�
- ▲TOP
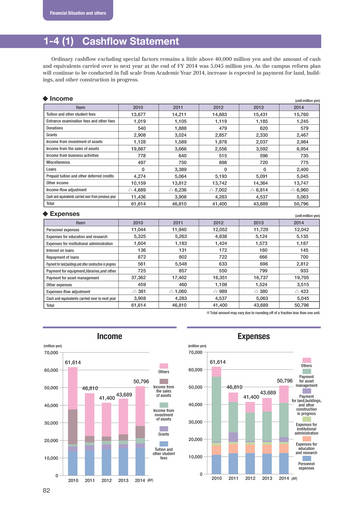
- ページ: 82
- Financial Situation and others
1-4 (1) Cashflow Statement
Ordinary cashflow excluding special factors remains a little above 40,000 million yen and the amount of cash and equivalents carried over to next year at the end of FY 2014 was 5,045 million yen. As the campus reform plan will continue to be conducted in full scale from Academic Year 2014, increase is expected in payment for land, buildings, and other construction in progress.
◆ Income
Item Tuition and other student fees
Entrance examination fees and other fees Donations Grants Income from investment of assets Income from the sales of assets Income from business activities Miscellaneous Loans Prepaid tuition and other deferred credits Other income Income-flow adjustment Cash and equivalents carried over from previous year Total
(unit:million yen)
2010
2011
2012
2013
2014
13,677 1,019 540 2,908 1,128 19,887 778 497 0 4,274 10,159 △ 4,689 11,436 61,614
14,211 1,105 1,888 3,024 1,589 3,666 640 750 3,389 5,064 13,812 △ 6,236 3,908 46,810
14,883 1,119 479 2,857 1,878 2,556 515 898 0 5,193 13,742 △ 7,002 4,283 41,400
15,431 1,185 620 2,330 2,037 3,592 596 720 0 5,091 14,364 △ 6,814 4,537 43,689
15,760 1,245 579 2,467 2,984 6,954 735 775 2,400 5,045 13,747 △ 6,960 5,063 50,796
(unit:million yen)
◆ Expenses
Item
Personnel expenses Expenses for education and research Expenses for institutional administration Interest on loans Repayment of loans Payment for land,buildings,and other construction in progress Payment for equipment,libraries,and other Payment for asset management Other expenses Expenses-flow adjustment Cash and equivalents carried over to next year Total
2010
2011
2012
2013
2014
11,044 5,325 1,604 136 872 561 725 37,362 459 △ 381 3,908 61,614
11,940 5,263 1,183 131 802 5,548 857 17,402 460 △ 1,060 4,283 46,810
12,052 4,838 1,424 172 722 633 550 16,351 1,108 △ 989 4,537 41,400
11,729 5,124 1,573 160 666 696 799 16,737 1,524 △ 380 5,063 43,689
12,042 5,135 1,187 145 700 2,812 933 19,705 3,515 △ 423 5,045 50,796
※Total amount may vary due to rounding off of a fraction less than one unit.
Income
(million yen) (million yen)
Expenses
70,000
70,000
61,614
60,000
Others
61,614
60,000
Others
50,796
50,000
50,796
Income from the sales of assets Income from investment of assets Grants
46,810 41,400 43,689
50,000
46,810 41,400
Payment for asset management
43,689
40,000
40,000
Payment for land,buildings, and other construction in progress Expenses for institutional administration Expenses for education and research Personnel expenses
30,000
30,000
20,000
Tuition and other student fees
20,000
10,000
10,000
0
0 2010 2011 2012 2013 2014 (AY)
2010
2011
2012
2013
2014 (AY)
82
�
- ▲TOP
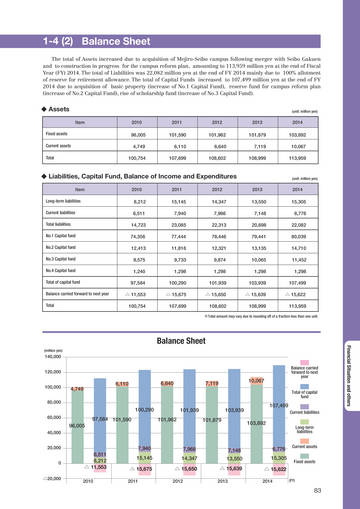
- ページ: 83
- 1-4 (2) Balance Sheet
The total of Assets increased due to acquisition of Mejiro-Seibo campus following merger with Seibo Gakuen and to construction in progress for the campus reform plan, amounting to 113,959 million yen at the end of Fiscal Year (FY) 2014. The total of Liabilities was 22,082 million yen at the end of FY 2014 mainly due to 100% allotment of reserve for retirement allowance. The total of Capital Funds increased to 107,499 million yen at the end of FY 2014 due to acquisition of basic property (increase of No.1 Capital Fund), reserve fund for campus reform plan (increase of No.2 Capital Fund), rise of scholarship fund (increase of No.3 Capital Fund).
◆ Assets
Item Fixed assets Current assets Total 2010 2011 2012 2013
(unit: million yen)
2014
96,005 4,749 100,754
101,590 6,110 107,699
101,962 6,640 108,602
101,879 7,119 108,999
103,892 10,067 113,959
◆ Liabilities, Capital Fund, Balance of Income and Expenditures
Item Long-term liabilities Current liabilities Total liabilities No.1 Capital fund No.2 Capital fund No.3 Capital fund No.4 Capital fund Total of capital fund Balance carried forward to next year Total 2010 2011 2012 2013
(unit: million yen)
2014
8,212 6,511 14,723 74,356 12,413 9,575 1,240 97,584 △ 11,553 100,754
15,145 7,940 23,085 77,444 11,816 9,733 1,298 100,290 △ 15,675 107,699
14,347 7,966 22,313 78,446 12,321 9,874 1,298 101,939 △ 15,650 108,602
13,550 7,148 20,698 79,441 13,135 10,065 1,298 103,939 △ 15,639 108,999
15,305 6,776 22,082 80,039 14,710 11,452 1,298 107,499 △ 15,622 113,959
※Total amount may vary due to rounding off of a fraction less than one unit.
Balance Sheet
(million yen)
Financial Situation and others
140,000 120,000 100,000 80,000 Balance carried forward to next year Total of capital fund
4,749
6,110
6,640
7,119
10,067
100,290
60,000
101,939 101,962 101,879
103,939 103,892
107,499
Current liabilities Long-term liabilities Current assets Fixed assets
97,584 101,590 96,005
40,000 20,000 0 △20,000
6,511 8,212 △ 11,553
2010
7,940 15,145 △ 15,675
2011
7,966 14,347 △ 15,650
2012
7,148 13,550 △ 15,639
2013
6,776 15,305 △ 15,622
2014
(FY)
83
�
- ▲TOP
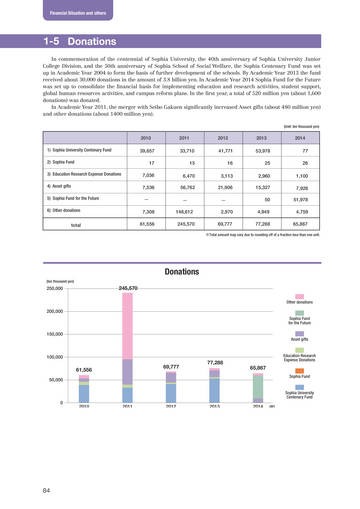
- ページ: 84
- Financial Situation and others
1-5 Donations
In commemoration of the centennial of Sophia University, the 40th anniversary of Sophia University Junior College Division, and the 50th anniversary of Sophia School of Social Welfare, the Sophia Centenary Fund was set up in Academic Year 2004 to form the basis of further development of the schools. By Academic Year 2013 the fund received about 30,000 donations in the amount of 3.8 billion yen. In Academic Year 2014 Sophia Fund for the Future was set up to consolidate the financial basis for implementing education and research activities, student support, global human resources activities, and campus reform plans. In the first year, a total of 520 million yen (about 1,600 donations) was donated. In Academic Year 2011, the merger with Seibo Gakuen significantly increased Asset gifts (about 480 million yen) and other donations (about 1400 million yen).
(Unit: ten thousand yen)
2010 1) Sophia University Centenary Fund 2) Sophia Fund 3) Education Research Expense Donations 4) Asset gifts 5) Sophia Fund for the Future 6) Other donations
2011
2012
2013
2014
39,657 17 7,036 7,536 - 7,308 61,556
33,710 15 6,470 56,762 - 148,612 245,570
41,771 16 3,113 21,906 - 2,970 69,777
53,978 25 2,960 15,327 50 4,949 77,288
77 26 1,100 7,926 51,978 4,759 65,867
total
※Total amount may vary due to rounding off of a fraction less than one unit.
Donations
(ten thousand yen)
250,000
245,570
Other donations
200,000
Sophia Fund for the Future
150,000
Asset gifts
100,000
61,556
50,000
69,777
77,288
Education Research Expense Donations
65,867
Sophia Fund
Sophia University Centenary Fund
0
2010
2011
2012
2013
2014
(AY)
84
�
- ▲TOP
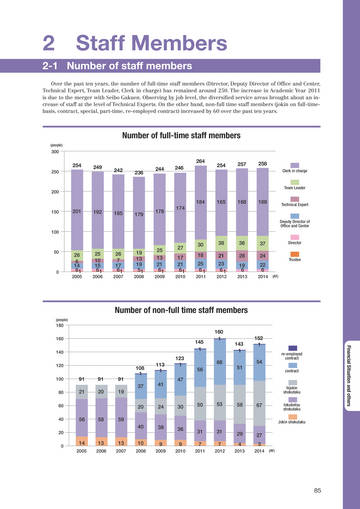
- ページ: 85
- 2 Staff Members
2-1 Number of staff members
Over the past ten years, the number of full-time staff members (Director, Deputy Director of Office and Center, Technical Expert, Team Leader, Clerk in charge) has remained around 250. The increase in Academic Year 2011 is due to the merger with Seibo Gakuen. Observing by job level, the diversified service areas brought about an increase of staff at the level of Technical Experts. On the other hand, non-full time staff members (jokin on full-timebasis, contract, special, part-time, re-employed contract) increased by 60 over the past ten years.
Number of full-time staff members
(people)
300
254
250
249
264 242 236 244 246
254
257
258
Clerk in charge
200
Team Leader
184
150
165
168
169
201
192
185
179
178
174
Technical Expert
Deputy Director of Office and Center
100
50
0
2005
26 6 14 61
2006
25 10 15 61
2007
26 7 17 61
2008
19 13 19 51
2009
25 13 21 61
27 17 21 61
30 18 25 61
38 21 23 61
36 28 19 6
2013
37 24 22 6
2014
(AY)
Director
Trustee
2010
2011
2012
Number of non-full time staff members
(people)
180 160 140 120 100 80 60 40 20 0
145 1 108 1 37 113 1 41 123 1 47
160 1
143 1 51
152 1 54
re-employed contract contract
Financial Situation and others
68 56
91 21
91 20
91 19
hijokin shokutaku
20 56 58 59 40 14
2005
24
30
50
53
58
67
tokubetsu shokutaku Jokin shokutaku
38 9
2009
36 9
2010
31 7
2011
31 7
2012
29 4
2013
27 3
2014
(AY)
13
2006
13
2007
10
2008
85
�
- ▲TOP
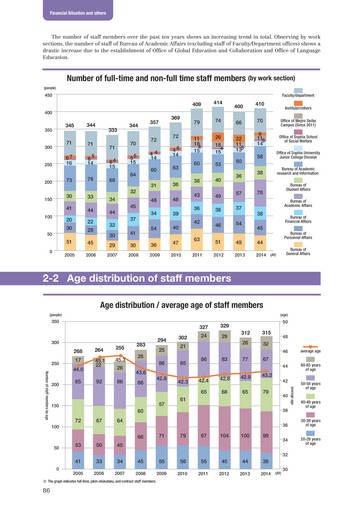
- ページ: 88
- Financial Situation and others
The number of staff members over the past ten years shows an increasing trend in total. Observing by work sections, the number of staff of Bureau of Academic Affairs (excluding staff of Faculty/Department offices) shows a drastic increase due to the establishment of Office of Global Education and Collaboration and Office of Language Education.
Number of full-time and non-full time staff members (by work section)
(people)
450
Faculty/department
409
400
414 74 26 18 4 15 53 40 49 38 46 51
2012
400 66 22 11 135 50 36 57 37 54
410 70 9 115 14 58 38
Instituter/others Office of Mejiro Seibo Campus (Since 2011) Office of Sophia School of Social Welfare Office of Sophia University Junior College Division Bureau of Academic research and Information Bureau of Student Affairs Bureau of Academic Affairs
350
345 71 67 16 73 30 41
344
333 71 64 15 68
344 70 55 15 64 32
357 72 44 14 60 31 48
369 72 46 14 63 36 48 39 40 47
2010
79 11 18 4 15 60 38 43 36 42 63
2011
300
71 5 6 14 76 33 44 22 28 45
2006
250
200
78
150
34 44 32 30 29
2007
45 37 41 30
2008
100
34 54 36
2009
20 30
38 45 44
2014 (AY)
Bureau of Financial Affairs Bureau of Personnel Affairs Bureau of General Affairs
50
51
0 2005
49
2013
2-2 Age distribution of staff members
Age distribution / average age of staff members
(people) (age)
350
327 283 26 86 43.6 86 42.8 85 42.3 61 294 25 302 21 86 24
329 29 312 26 83 77 42.9 65 315 32
50 48 46
average age 60-65 years of age 50-59 years of age 40-49 years of age 30-39 years of age 20-29 years of age
300
268
250
Number of staff members by age
264 45.1 22 92
255 45.3 26 86
17 44.0
67
44
200
85
42.4 65
42.8 68
43.2
42
average age
79
40 38 36
150
57 60 72 67 64 66 71
100
79
97
104
100
99
50
53 41
50 33
2006
45 34
2007
34 32
45
2008
55
2009
56
2010
55
2011
45
2012
44
2013
38
2014
(AY)
0
2005
30
※ The graph indicates full-time, jokin-shokutaku, and contract staff members.
86
�
- ▲TOP
- ページ: Back cover
- Of ce of Institutional Research / Of ce of Management Planning Sophia School Corporation
7-1 Kioi-cho, Chiyoda-ku, Tokyo, 102-85541
http://www.sophia.ac.jp
Issued on March 1, 2016
�
- ▲TOP
