(English Edition) Sophia Factbook 2014
- ページ: 19
- 1-3 State and trends of admission: Undergraduate
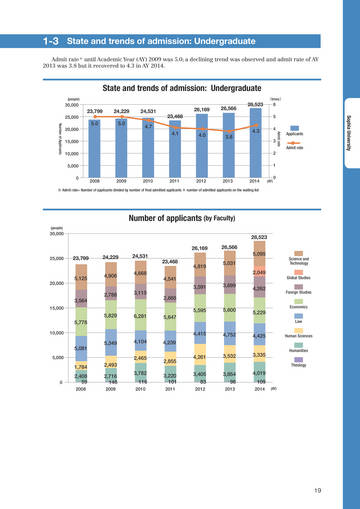
Admit rate ※ until Academic Year (AY) 2009 was 5.0; a declining trend was observed and admit rate of AY 2013 was 3.8 but it recovered to 4.3 in AY 2014.
State and trends of admission: Undergraduate
(people) (times)
30,000
23,799
25,000
24,229 5.0
24,531 4.7
26,169 23,468 4.1
26,566
28,523
6 5
Sophia University
5.0
20,000 15,000 10,000 5,000 0 2008
※ Admit rate= Number of applicants divided by number of final admitted applicants + number of admitted applicants on the waiting list
(people)
30,000
25,000
20,000
15,000
10,000
5,000
Number of Applicants
4.0
3.8
4.3
4
Admit rate
Applicants Admit rate
3 2 1
2009
2010
2011
2012
2013
2014
(AY)
0
Number of applicants (by Faculty)
28,523 26,169 23,799 24,229 4,906 24,531 4,668 23,468 4,541 3,591 2,865 5,595 5,647 4,415 5,081 1,784
0
26,566 5,095 5,031 2,049 3,699 4,262
Science and Technology Global Studies Foreign Studies Economics
4,819
5,125
3,564
2,788
3,115
5,829 5,778
5,600
6,281
5,229
Law
4,752
5,349
4,104 2,465
4,425
Human Sciences Humanities Theology
4,239 2,855 3,220 101
2011
4,261 3,405 83
2012
3,532 3,854 98
2013
3,335 4,019 109
2014
(AY)
2,493 2,716 148
2009
2,408 59
2008
3,782 116
2010
19
�
- ▲TOP