(English Edition) Sophia Factbook 2014
- ページ: 66
- Sophia University Junior College Division
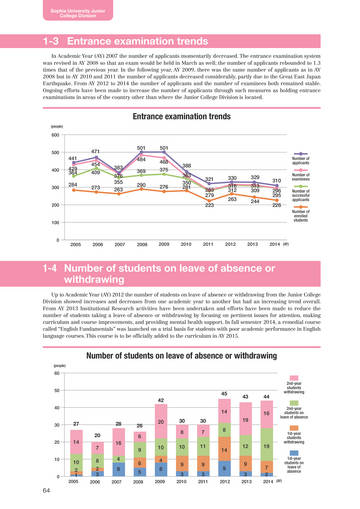
1-3 Entrance examination trends
In Academic Year (AY) 2007 the number of applicants momentarily decreased. The entrance examination system was revised in AY 2008 so that an exam would be held in March as well; the number of applicants rebounded to 1.3 times that of the previous year. In the following year, AY 2009, there was the same number of applicants as in AY 2008 but in AY 2010 and 2011 the number of applicants decreased considerably, partly due to the Great East Japan Earthquake. From AY 2012 to 2014 the number of applicants and the number of examinees both remained stable. Ongoing efforts have been made to increase the number of applicants through such measures as holding entrance examinations in areas of the country other than where the Junior College Division is located.
Entrance examination trends
(people)
600
500
471 441 429 364 284 454 409 273 383 376 355 263
501 484 369 290
501 468 375 276 388 363 350 281 321 283 279 223 330 316 312 263 329 313 309 244 310 296 295 226
Number of applicants Number of examinees Number of successful applicants Number of enrolled students
400
300
200
100
0
2005
2006
2007
2008
2009
2010
2011
2012
2013
2014 (AY)
1-4 Number of students on leave of absence or withdrawing
Up to Academic Year (AY) 2012 the number of students on leave of absence or withdrawing from the Junior College Division showed increases and decreases from one academic year to another but had an increasing trend overall. From AY 2013 Institutional Research activities have been undertaken and efforts have been made to reduce the number of students taking a leave of absence or withdrawing by focusing on pertinent issues for attention, making curriculum and course improvements, and providing mental health support. In fall semester 2014, a remedial course called “English Fundamentals” was launched on a trial basis for students with poor academic performance in English language courses. This course is to be officially added to the curriculum in AY 2015.
Number of students on leave of absence or withdrawing
(people)
60
2nd-year students withdrawing
50
45 42 14 27 20 14 28 26 6 16 9 4 8
2007
43
44 16
40
30
20
30 8
30 7 11 9 3
2011 2012
19 8 12 9 3
2013
2nd-year students on leave of absence
20
7 8 2 3
2006
10 4 8
2009
10 9 3
2010
14 9
19
1st-year students withdrawing
10
10 2 1
2005
6 5
2008
0
7 2
2014 (AY)
1st-year students on leave of absence
64
�
- ▲TOP