(English Edition) Sophia Factbook 2014
- ページ: 16
- Sophia University
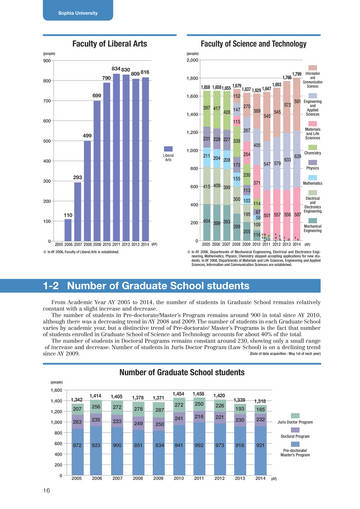
Faculty of Liberal Arts
(people) (people)
Faculty of Science and Technology
2,000
900
834 830
800
790 699
809 816
1,800
1,766 1,693
1,799 Information
700
1,658 1,658 1,655 1,679 1,637 1,629 1,647 152 1,600 397 417
1,400
and Communication Sciences
428 147 115
270
572 389 545 545
581 Engineering
and Applied Sciences
600
500
499
1,200
267 231 229 227 338 405 254 173 155 230 371 113 300 103 195 114 547 579 633 629
Materials and Life Sciences Chemistry Physics Mathematics Electrical and Electronics Engineering
400
Liberal Arts
1,000
211 204 208
800
300
293
600
415 409 399
200
400
110
100
200
404 399 393
299
205
67 557 556 587 58 501 109 Mechanical 116 19 12
7 12 4 1 1 4 1 5 3 1 1 1 1
Engineering
0
2005 2006 2007 2008 2009 2010 2011 2012 2013 2014 (AY)
0
2005 2006 2007 2008 2009 2010 2011 2012 2013 2014 (AY)
※ In AY 2006, Faculty of Liberal Arts is established.
※ In AY 2008, Departments of Mechanical Engineering, Electrical and Electronics Engineering, Mathematics, Physics, Chemistry stopped accepting applications for new students. In AY 2008, Departments of Materials and Life Sciences, Engineering and Applied Sciences, Information and Communication Sciences are established.
1-2 Number of Graduate School students
From Academic Year AY 2005 to 2014, the number of students in Graduate School remains relatively constant with a slight increase and decrease. The number of students in Pre-doctorate/Master’s Program remains around 900 in total since AY 2010, although there was a decreasing trend in AY 2008 and 2009. The number of students in each Graduate School varies by academic year, but a distinctive trend of Pre-doctorate/ Master’s Programs is the fact that number of students enrolled in Graduate School of Science and Technology accounts for about 40% of the total. The number of students in Doctoral Programs remains constant around 230, showing only a small range of increase and decrease. Number of students in Juris Doctor Program (Law School) is on a declining trend (Date of data acquisition : May 1st of each year) since AY 2009.
Number of Graduate School students
(people)
1,600 1,400 1,200 1,000 800 600 400 200 0 2005
1,342 207 263
1,414 256 235
1,405 272 233
1,378 278 249
1,371 287 250
1,454 272 241
1,458 250 216
1,420 226 221
1,339 193 230
1,318 165 232
Juris Doctor Program Doctoral Program
872
923
900
851
834
941
992
973
916
921
Pre-doctorate/ Master’s Program
2006
2007
2008
2009
2010
2011
2012
2013
2014
(AY)
16
�
- ▲TOP