(English Edition) Sophia Factbook 2014
- ページ: 40
- Sophia University
2-1(3)
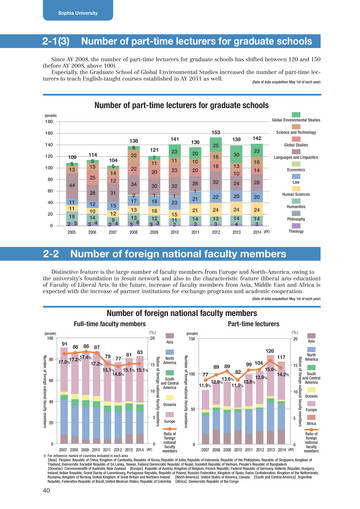
Number of part-time lecturers for graduate schools
Since AY 2008, the number of part-time lecturers for graduate schools has shifted between 120 and 150 (before AY 2008, above 100). Especially, the Graduate School of Global Environmental Studies increased the number of part-time lecturers to teach English-taught courses established in AY 2011 as well.
(Date of data acquisition: May 1st of each year)
Number of part-time lecturers for graduate schools
(people)
180 160 140 120 100 80 60 40 20 0
Global Environmental Studies
153 138 6 22 22 34 2 17 13 13 3 6
2008
Science and Technology
141 121 7 11 20 30 1 18 16 12 3 3
2009
136 20 10 20 26 1 21 21 14 3
2011
25 16 18 32 22 24 13 3
2012
139 30 13 10 24 20 24 14 4
2013
142
Global Studies
109 5 13 44
114 5 13 25 28
23 11 23 32 1 23 15 11 2
2010
23 16 14 28 20 24 14 3
2014 (AY)
Languages and Linguistics Economics Law Human Sciences Humanities Philosophy Theology
104 5 14 12 31 15 12 9 2 4
2007
11 11 18 2 5
2005
12 10 14 3 4
2006
2-2
Number of foreign national faculty members
Distinctive feature is the large number of faculty members from Europe and North-America, owing to the university’s foundation in Jesuit network and also to the characteristic feature (liberal arts education) of Faculty of Liberal Arts. In the future, increase of faculty members from Asia, Middle East and Africa is expected with the increase of partner institutions for exchange programs and academic cooperation.
(Date of data acquisition: May 1st of each year)
Number of foreign national faculty members
Full-time faculty members
(people) (%)
Part-time lecturers
20
(people) (%)
100
91
83 79 77 81 17.4% 80 17.2 % 17.0% 17.2% 15 15.1% 15.1% 15.1% 14.6%
60 10 40 5
86
86
87
Asia
150
20
Asia North America
126
North America
89
100
89
99 104 82
117 15.6%
15
Number of foreign national faculty members
Number of foreign national faculty members
Ration of foreign national faculty members
Ration of foreign national faculty members
South and Central America
13.9% 13.6% 12.9% 13.8% 11.9% 11.9%
77
14.2%
10
South and Central America Oceania Europe Africa Ratio of foreign national faculty members
Oceania
50 5
20
Europe Ratio of foreign national faculty members
0 2007 2008 2009 2010 2011 2012 2013 2014 (AY)
0
0
0 2007 2008 2009 2010 2011 2012 2013 2014 (AY)
※ For reference: names of countries included in each area 【Asia】Peoples’ Republic of China, Kingdom of Cambodia, Republic of Korea, Republic of India, Republic of Indonesia, Republic of the Philippines, Republic of Singapore, Kingdom of Thailand, Democratic Socialist Republic of Sri Lanka, Taiwan, Federal Democratic Republic of Nepal, Socialist Republic of Vietnam, People’s Republic of Bangladesh 【Oceania】Commonwealth of Australia, New Zealand 【Europe】Republic of Austria, Kingdom of Belgium, French Republic, Federal Republic of Germany, Hellenic Republic, Hungary, Ireland, Italian Republic, Grand Duchy of Luxembourg, Portuguese Republic, Republic of Poland, Russian Federation, Kingdom of Spain, Swiss Confederation, Kingdom of the Netherlands, Romania, Kingdom of Norway, United Kingdom of Great Britain and Northern Ireland 【North America】United States of America, Canada 【South and Central America】Argentine Republic, Federative Republic of Brazil, United Mexican States, Republic of Colombia 【Africa】Democratic Republic of the Congo
40
�
- ▲TOP