(English Edition) Sophia Factbook 2014
- ページ: 51
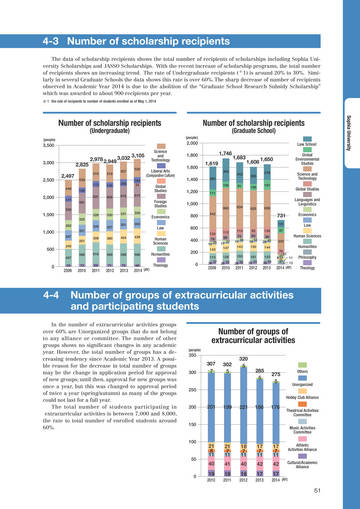
- 4-3 Number of scholarship recipients
The data of scholarship recipients shows the total number of recipients of scholarships including Sophia University Scholarships and JASSO Scholarships. With the recent increase of scholarship programs, the total number of recipients shows an increasing trend. The rate of Undergraduate recipients ( ※ 1) is around 20% to 30%. Similarly in several Graduate Schools the data shows this rate is over 60%. The sharp decrease of number of recipients observed in Academic Year 2014 is due to the abolition of the “Graduate School Research Subsidy Scholarship” which was awarded to about 900 recipients per year.
※1 the rate of recipients to number of students enrolled as of May 1, 2014
Sophia University
Number of scholarship recipients
(Undergraduate)
(people) (people)
Number of scholarship recipients
(Graduate School)
2,000
Law School
3,500
3,000
2,825 2,497
449 539
2,978 2,949 3,032
510 172 519 145 608 507 200 618
3,105
520 184 54 615
Science and Technology Liberal Arts (Comparative Culture) Global Studies Foreign Studies
1,800 1,600 1,400 1,200 1,000 800 600
134 542
1,746 1,619
383 380 105 111
1,683
342 91
1,608 1,650
283 106 259
Global Environmental Studies Science and Technology Global Studies Languages and Linguistics
2,500
161
160 631 591 326 325 330 327 380 331 301 329 300
2,000
177 530
663
634
625
608
1,500
292
Economics Law Human Sciences Humanities Theology
731
121 112 86 17 37 147 126 38 32 110 75 46 17 143 155 38 32 82 84 42 19 150 161 33 23 130 69 23 40 144 153 39 24 97
Economics Law Human Sciences
326 321 308
1,000
297 240 457
251
404
439
400 200 0
78 10 35 143 113 36 37
255
500
Humanities
76 21 9 45 11 37 47 12
566 72
616 89
569 71
598 73
596 68
Philosophy Theology
0
55
2009
2010
2011
2012
2013
2014 (AY)
2009
2010
2011
2012
2013
2014 (AY)
4-4
Number of groups of extracurricular activities and participating students
Number of groups of extracurricular activities
(people)
In the number of extracurricular activities groups over 60% are Unorganized groups that do not belong to any alliance or committee. The number of other groups shows no significant changes in any academic year. However, the total number of groups has a decreasing tendency since Academic Year 2013. A possible reason for the decrease in total number of groups may be the change in application period for approval of new groups; until then, approval for new groups was once a year, but this was changed to approval period of twice a year (spring/autumn) as many of the groups could not last for a full year. The total number of students participating in extracurricular activities is between 7,000 and 8,000, the rate to total number of enrolled students around 60%.
350
300
307 7
302 5
320 5
285 5
275 5
Others Unorganized Hobby Club Alliance
250
200
201
199
221
186
176
Theatrical Activities Committee Music Activities Committee
150
100
50
21 8 11 40 19
2010
21 7 11 41 18
2011
18 7 11 40 18
2012
17 7 11 42 17
2013
17 7 11 42 17
2014 (AY)
Athletic Activities Alliance Cultural/Academic Alliance
0
51
�
- ▲TOP