(English Edition) Sophia Factbook 2014
- ページ: 69
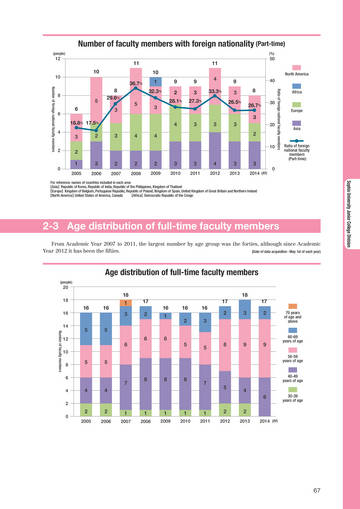
- Number of faculty members with foreign nationality (Part-time)
(people) (%)
12
11 10 36.7
%
11 10 1 32.3% 9 2 28.1% 3 4 3 3 9 3 27.3% 4 33.3% 9 3 26.5% 8 26.7% 3 3 2
50
North America
10
Number of foreign national faculty members
40
Ratio of foreign national faculty members
8
5 6 18.8% 17.5%
8 29.6% 3 5
Africa
30
6
Europe
20
4
Asia
3 2 1
2005
2
3
4
4
2
10
0
3
2006
2
2007
2
2008
2
2009
3
2010
3
2011
4
2012
3
2013
3
2014 (AY)
Ratio of foreign national faculty members (Part-time)
0
【Asia】Republic of Korea, Republic of India, Republic of the Philippines, Kingdom of Thailand 【Europe】Kingdom of Belgium, Portuguese Republic, Republic of Poland, Kingdom of Spain, United Kingdom of Great Britain and Northern Ireland United States of America, Canada 【North America】 【Africa】Democratic Republic of the Congo
For reference: names of countries included in each area
Sophia University Junior College Division
2-3 Age distribution of full-time faculty members
From Academic Year 2007 to 2011, the largest number by age group was the forties, although since Academic Year 2012 it has been the fifties. (Date of data acquisition : May 1st of each year)
Age distribution of full-time faculty members
(people)
20 18 16 14
Number of faculty members
18 16 16 1 3 5 5 6 6 5 5 8 8 8 6 5 5 8 17 16 2 1 16 2 16 3 17 2
18 17 3 2
70 years of age and above 60-69 years of age 50-59 years of age 40-49 years of age
12 10 8 6 4 2 0
9
9
7 4 4
7
5
4 6
30-39 years of age
2
2005
2
2006
1
2007
1
2008
1
2009
1
2010
1
2011
2
2012
2
2013 2014 (AY)
67
�
- ▲TOP