(English Edition) Sophia Factbook 2014
- ページ: 71
- 5 Career Options
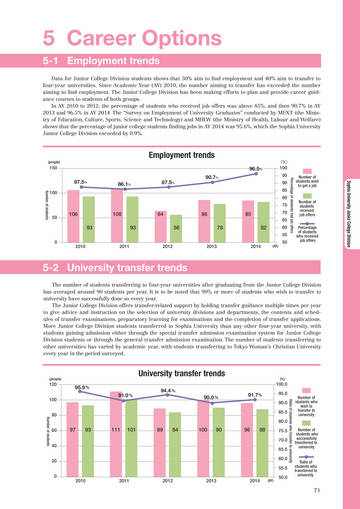
5-1 Employment trends
Data for Junior College Division students shows that 50% aim to find employment and 40% aim to transfer to four-year universities. Since Academic Year (AY) 2010, the number aiming to transfer has exceeded the number aiming to find employment. The Junior College Division has been making efforts to plan and provide career guidance courses to students of both groups. In AY 2010 to 2012, the percentage of students who received job offers was above 85%, and then 90.7% in AY 2013 and 96.5% in AY 2014. The “Survey on Employment of University Graduates” conducted by MEXT (the Ministry of Education, Culture, Sports, Science and Technology) and MHLW (the Ministry of Health, Labour and Welfare) shows that the percentage of junior college students finding jobs in AY 2014 was 95.6%, which the Sophia University Junior College Division exceeded by 0.9%.
(people)
Employment trends
96.5% 87.5% 86.1% 87.5% 90.7
%
(%)
150
100 95 90 85 80 75
Number of students wish to get a job
Percentage of students had job offers
Sophia University Junior College Division
100
5-2 University transfer trends
The number of students transferring to four-year universities after graduating from the Junior College Division has averaged around 90 students per year. It is to be noted that 90% or more of students who wish to transfer to university have successfully done so every year. The Junior College Division offers transfer-related support by holding transfer guidance multiple times per year to give advice and instruction on the selection of university divisions and departments, the contents and schedules of transfer examinations, preparatory learning for examinations and the completion of transfer applications. More Junior College Division students transferred to Sophia University than any other four-year university, with students gaining admission either through the special transfer admission examination system for Junior College Division students or through the general transfer admission examination. The number of students transferring to other universities has varied by academic year, with students transferring to Tokyo Woman’s Christian University every year in the period surveyed.
Number of students
50
106 93
108 93
64 56
86 78
85 82
70 65 60 55 50
Number of students received job offers Percentage of students who received job offers
0
2010
2011
2012
2013
2014
(AY)
(people)
University transfer trends
95.9 % 91.0 % 94.4 % 90.0 % 91.7%
(%)
120 100 80 60 40 20 0
100.0 95.0
Ratio of students who transfer to university
90.0 85.5 80.0
Number of students who wish to transfer to university Number of students who successfully transferred to university Ratio of students who transferred to university
Number of students
97
93
111
101
89
84
100
90
96
88
75.5 70.0 65.5 60.0 55.5
2010
2011
2012
2013
2014
(AY)
50.0
71
�
- ▲TOP