(English Edition) Sophia Factbook 2014
- ページ: 56
- Sophia University
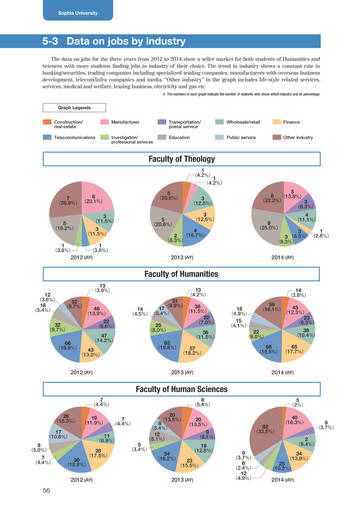
5-3 Data on jobs by industry
The data on jobs for the three years from 2012 to 2014 show a seller market for both students of Humanities and Sciences with more students finding jobs in industry of their choice. The trend in industry shows a constant rate in banking/securities, trading companies including specialized trading companies, manufacturers with overseas business development, telecom/infra companies and media. “Other industry” in the graph includes life-style related services, services, medical and welfare, leasing business, electricity and gas etc.
※ The numbers in each graph indicate the number of students who chose which industry and its percentage.
Graph Legends Construction/ real estate Telecommunications Manufacturer Investigation/ professional services Transportation/ postal service Education Wholesale/retail Public service Finance Other industry
Faculty of Theology
(4.2%)
1
(4.2%)
1
6 7 (26.9%) (23.1%)
(11.5%) (11.5%) (3.8%)
(20.8%)
5
3 (12.5%)
(12.5%)
8 (13.9%) (22.2%) 3 (8.3%) 9 (25.0%)
(11.1%)
5
3
(19.2%)
5
3
5 (20.8%)
3
4
(3.8%)
1
1
4 2 (16.7%) (8.3%)
1 3 3 (8.3%) (2.8%) (8.3%)
2012 (AY)
2013 (AY)
2014 (AY)
Faculty of Humanities
12 (3.6%) 18 (5.4%)
(3.9%) (9.7%)
13
(4.2%)
13
32
46 (13.9%)
(6.6%)
32 (9.7%)
(19.9%)
22
66
47 (14.2%)
(13.0%)
43
31 (9.9%) 36 17 14 (11.5%) (4.5%) (5.4%) 22 (7.0%) 25 (8.0%) 36 (11.5%) 62 (19.8%) 57 (18.2%)
(3.8%)
14
18 (4.9%) 15 (4.1%) 22
45 (16.1%) (12.3%)
59
(6.3%) (10.4%)
23
(6.0%)
38
(18.5%) (17.7%)
68
65
2012 (AY)
2013 (AY)
2014 (AY)
Faculty of Human Sciences
(4.4%) (16.3%) (10.6%)
7
(5.4%)
8
(2%) (16.3%)
5
26
(11.9%)
19
(4.4%)
7
17
8 (5.0%) 7 (4.4%)
(6.9%) (17.5%)
11
28
30 (18.8%)
20 (13.5%) 20 8 (13.5%) (5.4%) 9 12 (6.1%) (8.1%) 5 19 (3.4%) (12.8%) 24 (16.2%) 23 (15.5%)
40
82 (33.5%)
(3.7%)
9
(9.4%) (3.7%) (2.4%) (4.9%)
2
9 6
12
(10.2%)
25
(13.9%)
34
2012 (AY)
56
2013 (AY)
2014 (AY)
�
- ▲TOP