(English Edition) Sophia Factbook 2014
- ページ: 88
- Financial Situation and others
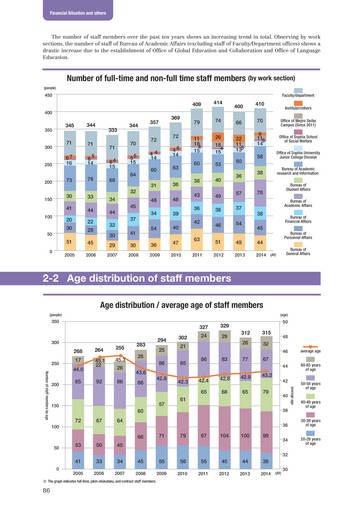
The number of staff members over the past ten years shows an increasing trend in total. Observing by work sections, the number of staff of Bureau of Academic Affairs (excluding staff of Faculty/Department offices) shows a drastic increase due to the establishment of Office of Global Education and Collaboration and Office of Language Education.
Number of full-time and non-full time staff members (by work section)
(people)
450
Faculty/department
409
400
414 74 26 18 4 15 53 40 49 38 46 51
2012
400 66 22 11 135 50 36 57 37 54
410 70 9 115 14 58 38
Instituter/others Office of Mejiro Seibo Campus (Since 2011) Office of Sophia School of Social Welfare Office of Sophia University Junior College Division Bureau of Academic research and Information Bureau of Student Affairs Bureau of Academic Affairs
350
345 71 67 16 73 30 41
344
333 71 64 15 68
344 70 55 15 64 32
357 72 44 14 60 31 48
369 72 46 14 63 36 48 39 40 47
2010
79 11 18 4 15 60 38 43 36 42 63
2011
300
71 5 6 14 76 33 44 22 28 45
2006
250
200
78
150
34 44 32 30 29
2007
45 37 41 30
2008
100
34 54 36
2009
20 30
38 45 44
2014 (AY)
Bureau of Financial Affairs Bureau of Personnel Affairs Bureau of General Affairs
50
51
0 2005
49
2013
2-2 Age distribution of staff members
Age distribution / average age of staff members
(people) (age)
350
327 283 26 86 43.6 86 42.8 85 42.3 61 294 25 302 21 86 24
329 29 312 26 83 77 42.9 65 315 32
50 48 46
average age 60-65 years of age 50-59 years of age 40-49 years of age 30-39 years of age 20-29 years of age
300
268
250
Number of staff members by age
264 45.1 22 92
255 45.3 26 86
17 44.0
67
44
200
85
42.4 65
42.8 68
43.2
42
average age
79
40 38 36
150
57 60 72 67 64 66 71
100
79
97
104
100
99
50
53 41
50 33
2006
45 34
2007
34 32
45
2008
55
2009
56
2010
55
2011
45
2012
44
2013
38
2014
(AY)
0
2005
30
※ The graph indicates full-time, jokin-shokutaku, and contract staff members.
86
�
- ▲TOP