(English Edition) Sophia Factbook 2014
- ページ: 20
- Sophia University
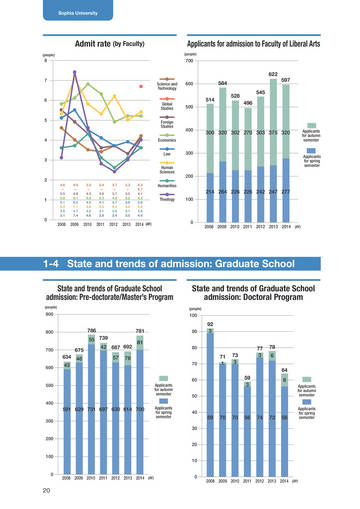
Admit rate (by Faculty)
(people)
Applicants for admission to Faculty of Liberal Arts
(people)
8
700
622
7
Science and Technology Global Studies Foreign Studies Economics Law
600
584 514 528 496 545
597
6
500
5
400
300 320 302 270 303 375 320
4
Applicants for autumn semester
300
3
Human Sciences
Applicants for spring semester
2
4.6 — 5.5 5.8 5.1 5.3 3.6 3.1 4.0 — 4.9 6.1 5.5 7.1 3.7 7.4 3.5 — 4.3 6.8 4.5 5.8 4.3 4.6 3.4 — 3.6 6.3 4.1 5.3 3.1 2.8 3.7 — 3.7 4.9 3.7 6.2 2.6 2.4 3.3 — 3.3 5.2 3.9 5.0 3.1 3.0 4.2 6.7 4.1 5.2 3.6 5.4 3.6 4.0
200
Humanities
214 264 226 226 242 247 277
Theology
1
100
0
2008
2009
2010
2011
2012
2013
2014 (AY)
0
2008 2009 2010 2011 2012 2013 2014 (AY)
1-4 State and trends of admission: Graduate School
State and trends of Graduate School admission: Pre-doctorate/Master’s Program
(people)
State and trends of Graduate School admission: Doctoral Program
(people)
900
100
800
786
781
90 80 70 60
92 3 77 3 78 6 64
700
675 634 46 43
55 739 81 42 687 692 57 78
600
71 1
73 3 59 3
500
Applicants for autumn semester
8
Applicants for autumn semester Applicants for spring semester
50 40 30
400
591 629 731 697 630 614 700
300
Applicants for spring semester
89
70
70
56
74
72
56
200
20
100
10 0
0
2008 2009 2010 2011 2012 2013 2014 (AY)
2008 2009 2010 2011 2012 2013 2014 (AY)
20
�
- ▲TOP