(English Edition) Sophia Factbook 2014
- ページ: 83
- 1-4 (2) Balance Sheet
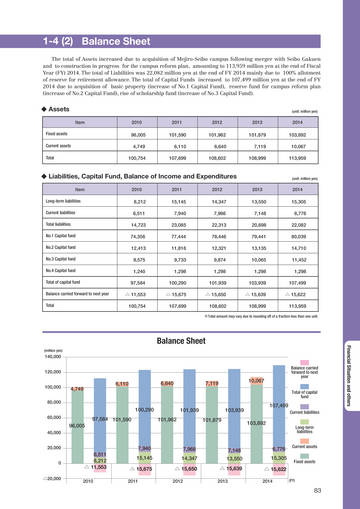
The total of Assets increased due to acquisition of Mejiro-Seibo campus following merger with Seibo Gakuen and to construction in progress for the campus reform plan, amounting to 113,959 million yen at the end of Fiscal Year (FY) 2014. The total of Liabilities was 22,082 million yen at the end of FY 2014 mainly due to 100% allotment of reserve for retirement allowance. The total of Capital Funds increased to 107,499 million yen at the end of FY 2014 due to acquisition of basic property (increase of No.1 Capital Fund), reserve fund for campus reform plan (increase of No.2 Capital Fund), rise of scholarship fund (increase of No.3 Capital Fund).
◆ Assets
Item Fixed assets Current assets Total 2010 2011 2012 2013
(unit: million yen)
2014
96,005 4,749 100,754
101,590 6,110 107,699
101,962 6,640 108,602
101,879 7,119 108,999
103,892 10,067 113,959
◆ Liabilities, Capital Fund, Balance of Income and Expenditures
Item Long-term liabilities Current liabilities Total liabilities No.1 Capital fund No.2 Capital fund No.3 Capital fund No.4 Capital fund Total of capital fund Balance carried forward to next year Total 2010 2011 2012 2013
(unit: million yen)
2014
8,212 6,511 14,723 74,356 12,413 9,575 1,240 97,584 △ 11,553 100,754
15,145 7,940 23,085 77,444 11,816 9,733 1,298 100,290 △ 15,675 107,699
14,347 7,966 22,313 78,446 12,321 9,874 1,298 101,939 △ 15,650 108,602
13,550 7,148 20,698 79,441 13,135 10,065 1,298 103,939 △ 15,639 108,999
15,305 6,776 22,082 80,039 14,710 11,452 1,298 107,499 △ 15,622 113,959
※Total amount may vary due to rounding off of a fraction less than one unit.
Balance Sheet
(million yen)
Financial Situation and others
140,000 120,000 100,000 80,000 Balance carried forward to next year Total of capital fund
4,749
6,110
6,640
7,119
10,067
100,290
60,000
101,939 101,962 101,879
103,939 103,892
107,499
Current liabilities Long-term liabilities Current assets Fixed assets
97,584 101,590 96,005
40,000 20,000 0 △20,000
6,511 8,212 △ 11,553
2010
7,940 15,145 △ 15,675
2011
7,966 14,347 △ 15,650
2012
7,148 13,550 △ 15,639
2013
6,776 15,305 △ 15,622
2014
(FY)
83
�
- ▲TOP