(English Edition) Sophia Factbook 2014
- ページ: 47
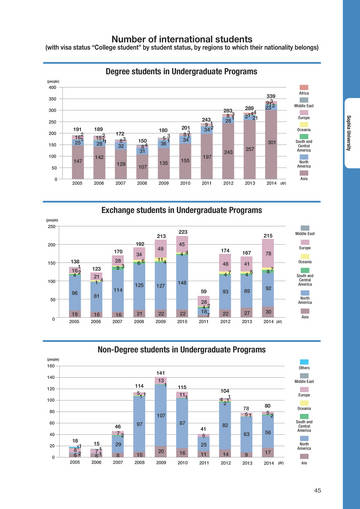
- (with visa status “College student” by student status, by regions to which their nationality belongs)
Number of international students
Degree students in Undergraduate Programs
(people)
400 350 300 250 200 150 100 50 0 2005 2006
191 2 161 25 147
189 2 15 1 28 1 142
172 83 32 129
150 84 31 107
2008
180 3 51 36
201 83 1 34
243 9 1 34 2
283 8 3 1 28
289 44 21 21
339 3 91 23 2
Africa Middle East Europe Oceania
Sophia University
301 197 243 257
South and Central America North America Asia
135
155
2007
2009
2010
2011
2012
2013
2014 (AY)
Exchange students in Undergraduate Programs
(people)
250
213
200
223 45 4 4 174 48 47 167 41 4 89 6
215 78
Middle East Europe Oceania
192 170 138 1 16 2 4 96 28 9 3 34 66
49 114
150
123 21 1 4
87 92
100
114 81 16
2006
125
127
148 59 28 42 18 7
2011
South and Central America North America
93
50
0
19
2005
16
2007
21
2008
22
2009
22
2010
22
2012
27
2013
30
2014 (AY)
Asia
Non-Degree students in Undergraduate Programs
(people)
160 140 120 100 80 60 40 20 0
114 5 1 1
141 13 1
Others Middle East
115 111
104 1 4 1 2
Europe
107 46 72 15 1 71 6
2006
78 51
80 5
Oceania
2
South and Central America North America Asia
97
87
18 11 8 62
2005
41 5 25 11
2011
82 63 56
29 8
2007
10
2008
20
2009
16
2010
14
2012
9
2013
17
2014 (AY)
45
�
- ▲TOP