(English Edition) Sophia Factbook 2014
- ページ: 49
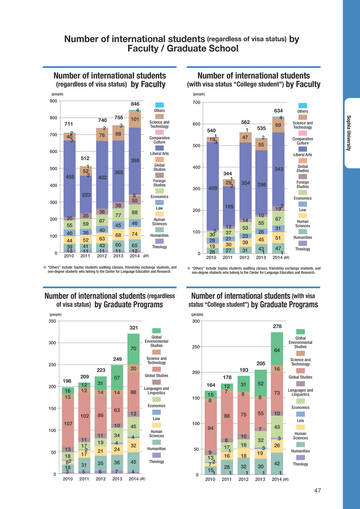
- Number of international students (regardless of visa status) by Faculty / Graduate School
Number of international students (regardless of visa status) by Faculty
(people)
(with visa status “College student”) by Faculty
(people)
Number of international students
900
846 4 711 740 2 76 755 3 88 101
700
Others Science and Technology Comparative Culture Liberal Arts
800
600
562 540 1 19 3 1 47
700
2 40 3 512
535 2 55
634 4 69
Others
Sophia University
Science and Technology Comparative Culture Liberal Arts
500
600
500
455
400
1 52 2
398 402 365
Global Studies Foreign Studies
400
300
409
344 1 29 2
343 354 298
Global Studies Foreign Studies Economics
223
300
38 20 55 40 44 39 13 35 59 36 52 41 11 36 67 40 63 43 11 77 45 68 60 11
8 50 88 46 74 65 12
Economics Law Human Sciences Humanities Theology
200
185 14 53 23 39 31
2012
2 19 10 55 26 45
2013
Law Human Sciences Humanities Theology
200
67 31 51 47 1
100
100
0
2010
2011
2012
2013
2014 (AY)
0
2010
5 30 28 19 26
12 37 21 30 27
2011
43 1
2014 (AY)
※ “Others” include Sophia students auditing classes, friendship exchange students, and non-degree students who belong to the Center for Language Education and Research.
※ “Others” include Sophia students auditing classes, friendship exchange students, and non-degree students who belong to the Center for Language Education and Research.
Number of international students (regardless of visa status) by Graduate Programs
(people)
Number of international students (with visa status “College student”) by Graduate Programs
(people)
350
300
321
300
Global Environmental Studies Science and Technology
278
Global Environmental Studies Science and Technology Global Studies
70 249
250
250
64 205 16
223 198 209 12 12 31 14 57 14 63 10 11 17 2 17 31 5
2011
20
Global Studies Languages and Linguistics
200
193 178 164 15 8 12 7 31 8 52 6 55 7 2011 8 17 1 16 28 1
2011
200
16 13
88
150
Economics
73
Languages and Linguistics Economics
150
102 107
100
86
13 45 4 32 45 4
2014 (AY)
Law Human Sciences Humanities Theology
88
100
75
10
Law
94 2010 10 2012 18 18 32 1
2012
43 3 2014 26 42 1
2014 (AY)
Human Sciences Humanities Theology
11 19 21 35 6
2012
50
0
13 18 82 18 3
2010
34 4 24 36 7
2013
2013 32 3 19 30 1
2013
50
0
9 13 2 7 15 1
2010
47
�
- ▲TOP